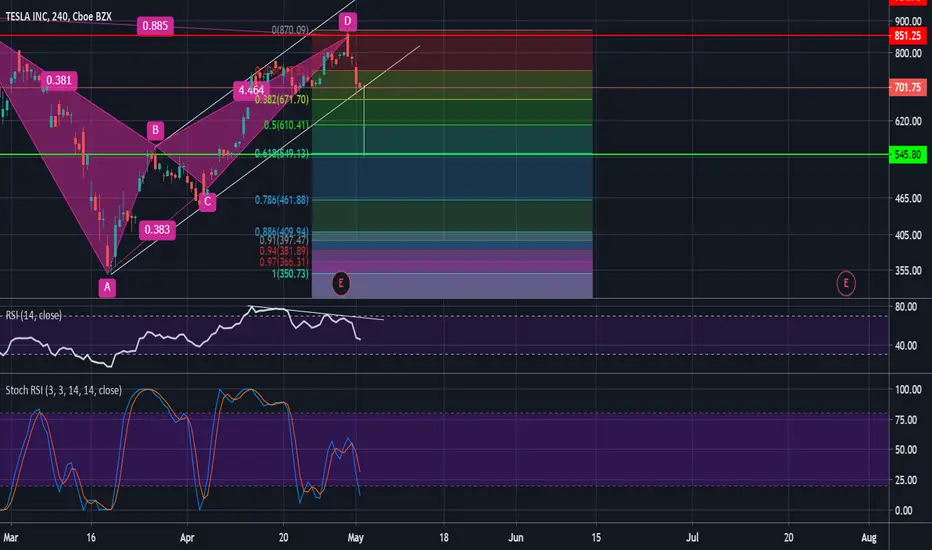
As the title states, we have a confluence of bearish indications to suggest a move to the downside. The last move went up in price but rsi made a lower high showing the weakness of the move. The stoch rsi has crossed down as well and it is on the verge of collapsing from the bearish flag pattern. Ideally a trader would wait for clear break of the trendline of the bottom (supporting) trendline of the bear-flag before shorting so perhaps draw that trendline on your own chart and short once you see a nice breakdown. Confluence such as the extrapolation of the bear flag suggests the next leg down would be to the golden fibonacci which coincides currently withe the 200 MA (red moving average). So if one is looking for an entry point to long a trade, that would be the area (green line).
I AM NOT A FINANCIAL ADVISER, DO YOUR OWN RESEARCH!
I AM NOT A FINANCIAL ADVISER, DO YOUR OWN RESEARCH!
Related publications
Disclaimer
The information and publications are not meant to be, and do not constitute, financial, investment, trading, or other types of advice or recommendations supplied or endorsed by TradingView. Read more in the Terms of Use.
Related publications
Disclaimer
The information and publications are not meant to be, and do not constitute, financial, investment, trading, or other types of advice or recommendations supplied or endorsed by TradingView. Read more in the Terms of Use.