📊 Technical Analysis (1H + 15-Min Confluence)
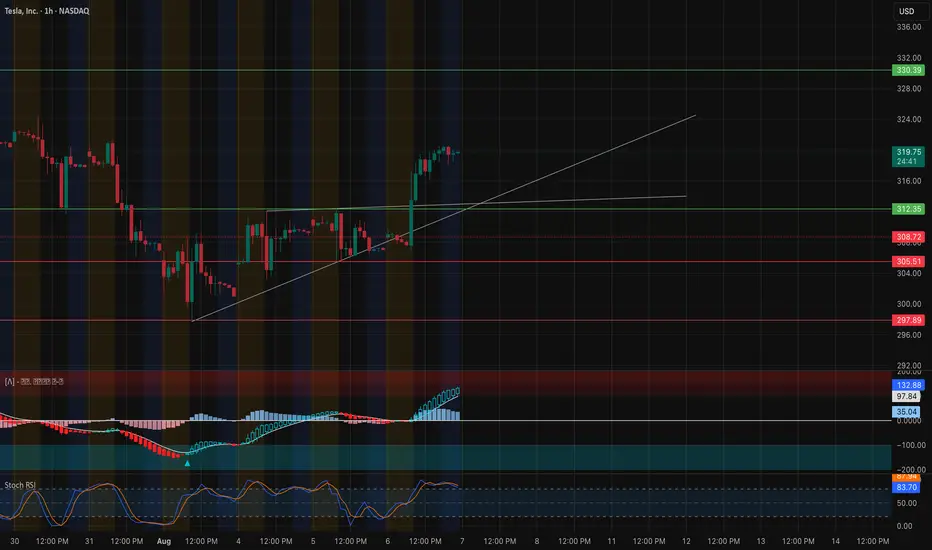
TSLA has surged out of its $308–$312 consolidation range with strong bullish momentum. It's now pressing against the key resistance zone just under $320, with clean price structure and a rising trendline.
* Trend: Higher lows with a breakout above structure = bullish continuation bias
* MACD: Bullish crossover + expanding histogram = momentum building
* Stoch RSI: Overbought at 88+ = short-term cooling possible, but not a sell signal on its own
* Volume: Strong breakout volume confirms interest — now needs follow-through above $320
Key Levels to Watch:
* Support Zones:
* $317.50 (micro support)
* $312.35 (breakout base / trendline confluence)
* $308.72 (former top of range)
* Resistance Zones:
* $319.85 (current high)
* $322.50 (major gamma wall)
* $325 → $330.39 (stacked supply above)
Scalping Setup (15-Min View):
* Entry (CALLs): Break and hold above $320
* Target: $322.50 then $325
* Stop: Below $317.50
* Bias: Momentum continuation as long as price holds trendline + VWAP
🔬 GEX-Based Option Sentiment (1H GEX Map)

The options market is now showing significant gamma resistance overhead, making this a crucial inflection zone:
* CALL Walls:
* $319.85 = 2nd CALL Wall (95.21%) — this is where price is currently pausing
* $322.50 = 3rd CALL Wall (86.55%)
* $325–$330 = GEX10/GEX7 cluster — potential fade zone
* PUT Support:
* $305 = HVL + strong buyer interest
* $300 = -26.58% PUT Wall
* $297.83 = 3rd PUT Wall — major dealer de-hedging zone
* Net GEX Bias:
* Positive GEX above $312.50 → bullish momentum slows as dealers hedge
* Below $305 = faster downside risk (gamma unwind)
* IVR 5.5, IVx Avg 51.4 → IV drop = favorable for buying options, not selling them
🎯 Options Trade Ideas:
* Bullish Swing (Speculative Breakout):
* Entry: Break > $322.50
* Target: $325 / $330
* Stop: < $317.5
* Bearish Fade (Gamma Cap Reversal):
* Entry: Reject below $320 with stalling momentum
* Target: $312.5 / $308
* Stop: Close > $322.5
⚠️ My Thoughts:
TSLA is at a key gamma inflection point. Price structure supports more upside, but dealer positioning above $322.5 may cap momentum unless volume forces a squeeze. Use trendline and VWAP confluence as your confirmation anchors — and watch for failed breakout traps into overhead gamma zones.
This analysis is for educational purposes only and does not constitute financial advice. Always do your own research and manage your risk before trading.
TSLA has surged out of its $308–$312 consolidation range with strong bullish momentum. It's now pressing against the key resistance zone just under $320, with clean price structure and a rising trendline.
* Trend: Higher lows with a breakout above structure = bullish continuation bias
* MACD: Bullish crossover + expanding histogram = momentum building
* Stoch RSI: Overbought at 88+ = short-term cooling possible, but not a sell signal on its own
* Volume: Strong breakout volume confirms interest — now needs follow-through above $320
Key Levels to Watch:
* Support Zones:
* $317.50 (micro support)
* $312.35 (breakout base / trendline confluence)
* $308.72 (former top of range)
* Resistance Zones:
* $319.85 (current high)
* $322.50 (major gamma wall)
* $325 → $330.39 (stacked supply above)
Scalping Setup (15-Min View):
* Entry (CALLs): Break and hold above $320
* Target: $322.50 then $325
* Stop: Below $317.50
* Bias: Momentum continuation as long as price holds trendline + VWAP
🔬 GEX-Based Option Sentiment (1H GEX Map)
The options market is now showing significant gamma resistance overhead, making this a crucial inflection zone:
* CALL Walls:
* $319.85 = 2nd CALL Wall (95.21%) — this is where price is currently pausing
* $322.50 = 3rd CALL Wall (86.55%)
* $325–$330 = GEX10/GEX7 cluster — potential fade zone
* PUT Support:
* $305 = HVL + strong buyer interest
* $300 = -26.58% PUT Wall
* $297.83 = 3rd PUT Wall — major dealer de-hedging zone
* Net GEX Bias:
* Positive GEX above $312.50 → bullish momentum slows as dealers hedge
* Below $305 = faster downside risk (gamma unwind)
* IVR 5.5, IVx Avg 51.4 → IV drop = favorable for buying options, not selling them
🎯 Options Trade Ideas:
* Bullish Swing (Speculative Breakout):
* Entry: Break > $322.50
* Target: $325 / $330
* Stop: < $317.5
* Bearish Fade (Gamma Cap Reversal):
* Entry: Reject below $320 with stalling momentum
* Target: $312.5 / $308
* Stop: Close > $322.5
⚠️ My Thoughts:
TSLA is at a key gamma inflection point. Price structure supports more upside, but dealer positioning above $322.5 may cap momentum unless volume forces a squeeze. Use trendline and VWAP confluence as your confirmation anchors — and watch for failed breakout traps into overhead gamma zones.
This analysis is for educational purposes only and does not constitute financial advice. Always do your own research and manage your risk before trading.
Disclaimer
The information and publications are not meant to be, and do not constitute, financial, investment, trading, or other types of advice or recommendations supplied or endorsed by TradingView. Read more in the Terms of Use.
Disclaimer
The information and publications are not meant to be, and do not constitute, financial, investment, trading, or other types of advice or recommendations supplied or endorsed by TradingView. Read more in the Terms of Use.