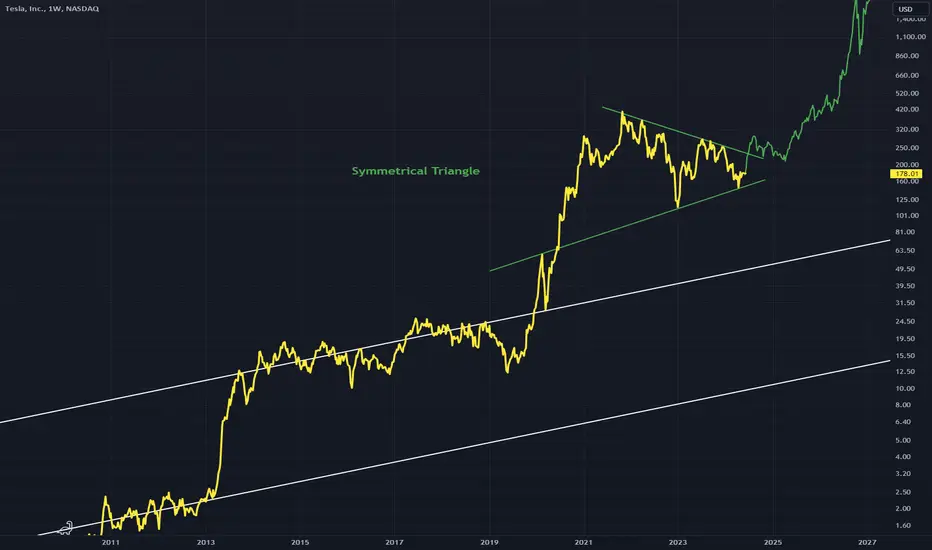
A symmetrical triangle is forming on this TSLA chart
These tend to break to the upside.
The white lines are strong trend lines if the triangle ends up breaking down
Bullish stock choice.
These tend to break to the upside.
The white lines are strong trend lines if the triangle ends up breaking down
Bullish stock choice.
Disclaimer
The information and publications are not meant to be, and do not constitute, financial, investment, trading, or other types of advice or recommendations supplied or endorsed by TradingView. Read more in the Terms of Use.
Disclaimer
The information and publications are not meant to be, and do not constitute, financial, investment, trading, or other types of advice or recommendations supplied or endorsed by TradingView. Read more in the Terms of Use.