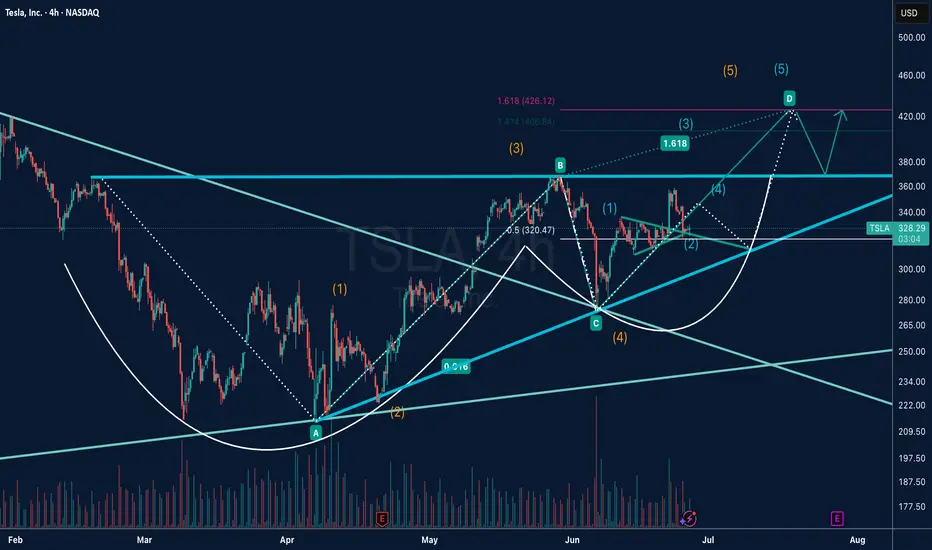
This chart presents a detailed Elliott Wave analysis on Tesla (TSLA) in the 4-hour timeframe.
The price structure from the April low suggests a completed corrective ABC pattern, forming a solid wave (4) base.
A new bullish impulse appears to be underway, with wave (1) and (2) of wave (5) already confirmed.
We are now tracking the development of wave (3), which has the potential to extend toward the 1.618 Fibonacci extension zone around $426, with intermediate resistance at $406.84 (1.414 Fib).
The projected wave (5) could complete near $440, marking the end of a larger degree 5-wave impulse structure.
Key levels to watch: support near $320.47 (0.5 retracement level of wave 1–3) and resistance at $360–380 before the next leg higher.
Two possible scenarios are outlined:
Primary Path (solid lines): Strong bullish continuation toward wave D and (5).
Alternate Path (dotted lines): Short-term correction back to the trendline support before resuming the uptrend.
The chart also highlights the breakout from a long-term descending trendline and a potential cup-and-handle continuation pattern, supporting the bullish thesis.
📈 Trade Plan: Watching for confirmation above $360 to target $406 and $426+ in the coming weeks. Stops should be considered below $310 depending on risk tolerance.
NFA
Disclaimer
The information and publications are not meant to be, and do not constitute, financial, investment, trading, or other types of advice or recommendations supplied or endorsed by TradingView. Read more in the Terms of Use.
Disclaimer
The information and publications are not meant to be, and do not constitute, financial, investment, trading, or other types of advice or recommendations supplied or endorsed by TradingView. Read more in the Terms of Use.