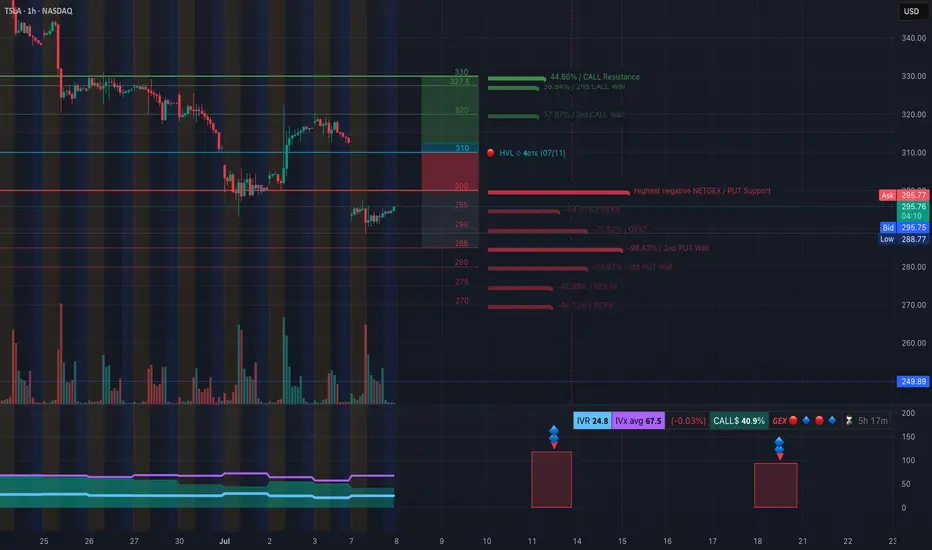
The GEX (Gamma Exposure) chart signals heavy PUT-dominant sentiment:
* Highest Negative NetGEX / PUT Support is stacked tightly around 295, with major Put Walls between 290 and 275.
* GEX clusters:
* -98.4% at $285
* -74.9% at $280
* -46% at $270
* On the upside, CALL resistance begins around 310–320, with GEX cooling off at 330.
🔍 Interpretation:
* Market makers are likely to hedge against upward price moves, increasing resistance near 310–320.
* Downside movement toward 285–280 could accelerate gamma momentum, causing a potential drop toward 270.
📉 Options Setup Suggestion:
* If price rejects at $297–300, buying PUTS (1–2 DTE) with target at 285 could benefit from GEX tailwinds.
* Avoid CALLs unless price breaks above 310 with volume.
TSLA 1-Hour Chart Technicals: Compression & Reaction Zone at Key Structure

The 1H chart shows:
* A recent Change of Character (ChoCH) and Break of Structure (BOS) near 290–295, indicating an attempt to reverse short-term bearish trend.
* Price is consolidating within a small demand zone (green box) and trying to retest the 295–297 region.
* However, TSLA remains under a macro downtrend with the descending channel intact.
🎯 Key Zones:
* Resistance: $297 → $305 → $310
* Support: $288.77 (LTF BOS) → $285 → $280
* Volume shows weak bullish momentum so far, not strong enough to push through resistance decisively.
⚠️ Trade Setup Ideas:
* PUT Scenario: If price fails to reclaim 297, consider entering near 296–297 with stop above 300. Target: 288 → 285.
* CALL Scenario (Risky): Only consider Calls above close + hold over 300, aiming for 310 with tight stop below 297.
🧠 Final Thoughts:
* Bias: Bearish to Neutral until price shows strong reclaim above 300.
* GEX setup favors PUT plays, especially on weakness below 295.
* If shorting, watch for reaction at 285 — this is the last solid gamma level before an air pocket to 270.
* Stay nimble, use stops, and respect trendline pressure overhead.
Disclaimer: This analysis is for educational purposes only and does not constitute financial advice. Always do your own research and manage your risk before trading.
* Highest Negative NetGEX / PUT Support is stacked tightly around 295, with major Put Walls between 290 and 275.
* GEX clusters:
* -98.4% at $285
* -74.9% at $280
* -46% at $270
* On the upside, CALL resistance begins around 310–320, with GEX cooling off at 330.
🔍 Interpretation:
* Market makers are likely to hedge against upward price moves, increasing resistance near 310–320.
* Downside movement toward 285–280 could accelerate gamma momentum, causing a potential drop toward 270.
📉 Options Setup Suggestion:
* If price rejects at $297–300, buying PUTS (1–2 DTE) with target at 285 could benefit from GEX tailwinds.
* Avoid CALLs unless price breaks above 310 with volume.
TSLA 1-Hour Chart Technicals: Compression & Reaction Zone at Key Structure
The 1H chart shows:
* A recent Change of Character (ChoCH) and Break of Structure (BOS) near 290–295, indicating an attempt to reverse short-term bearish trend.
* Price is consolidating within a small demand zone (green box) and trying to retest the 295–297 region.
* However, TSLA remains under a macro downtrend with the descending channel intact.
🎯 Key Zones:
* Resistance: $297 → $305 → $310
* Support: $288.77 (LTF BOS) → $285 → $280
* Volume shows weak bullish momentum so far, not strong enough to push through resistance decisively.
⚠️ Trade Setup Ideas:
* PUT Scenario: If price fails to reclaim 297, consider entering near 296–297 with stop above 300. Target: 288 → 285.
* CALL Scenario (Risky): Only consider Calls above close + hold over 300, aiming for 310 with tight stop below 297.
🧠 Final Thoughts:
* Bias: Bearish to Neutral until price shows strong reclaim above 300.
* GEX setup favors PUT plays, especially on weakness below 295.
* If shorting, watch for reaction at 285 — this is the last solid gamma level before an air pocket to 270.
* Stay nimble, use stops, and respect trendline pressure overhead.
Disclaimer: This analysis is for educational purposes only and does not constitute financial advice. Always do your own research and manage your risk before trading.
Disclaimer
The information and publications are not meant to be, and do not constitute, financial, investment, trading, or other types of advice or recommendations supplied or endorsed by TradingView. Read more in the Terms of Use.
Disclaimer
The information and publications are not meant to be, and do not constitute, financial, investment, trading, or other types of advice or recommendations supplied or endorsed by TradingView. Read more in the Terms of Use.