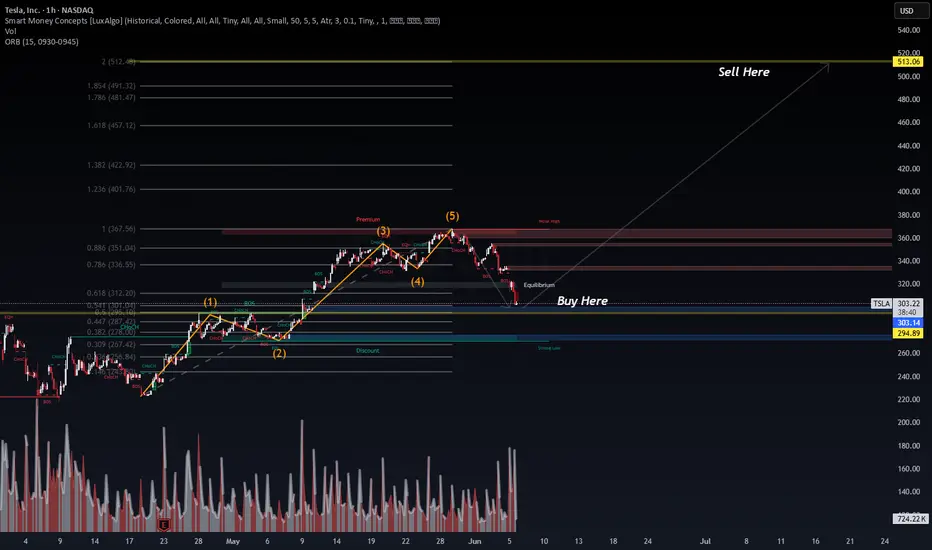
🕒 1H Chart | Wave Structure + Liquidity Sweep | Vol: 680K+
🔍 Context:
TSLA appears to have completed a textbook 5-wave impulse, peaking near $385. Price has now retraced into the discount zone, testing a prior equilibrium and FVG (Fair Value Gap)—ideal for reaccumulation.
🧠 Technical Breakdown:
✅ Wave Count Complete: Elliott Wave (1–5) structure suggests a cycle top was formed.
📉 Current Retracement: Price is approaching the 0.5–0.618 Fibonacci retracement and strong OB zone around $294–$303, aligning with Smart Money’s typical entry zones.
📦 Choch → BOS Confirmation: Bullish structure shift suggests a potential reversal zone.
💰 Buy Zone: $294.89 (key low) to $303.17 (equilibrium).
🎯 Target: $513.06 (Fibonacci extension + liquidity cluster).
🧮 Probability Outlook:
📈 Bullish Probability: 70% — Favoring upward continuation post-retrace.
📉 Bearish Breakdown: 30% — If $294 fails, expect deeper retracement toward $267 support.
📊 Strategy Suggestion:
Wait for a bullish confirmation candle near $294–303 zone. Add size above break of minor BOS. Target premium levels with trailing stop logic.
#TSLA #SmartMoneyConcepts #Fibonacci #ElliottWave #VolumeProfile #TradingStrategy #WaverVanirInternational
Note
Original Idea: 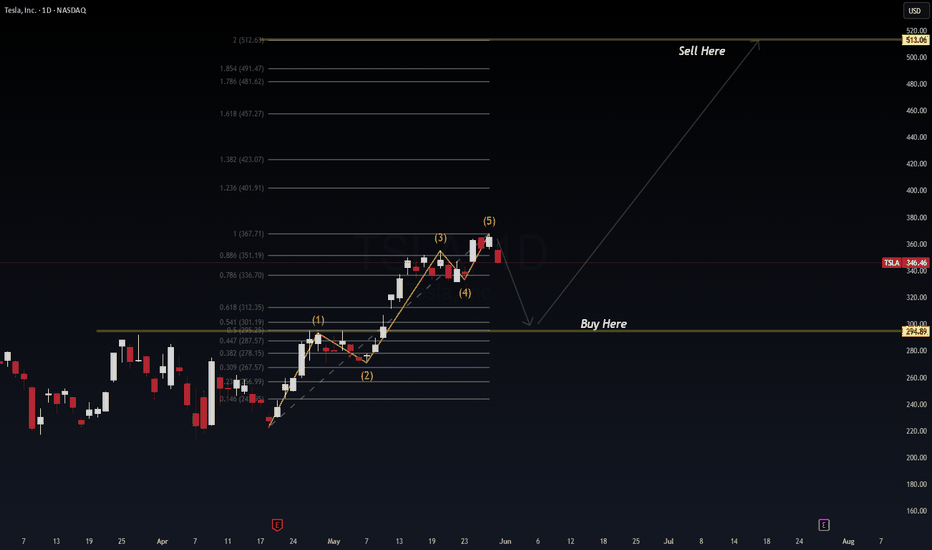
Note
Order cancelled
Disclaimer
The information and publications are not meant to be, and do not constitute, financial, investment, trading, or other types of advice or recommendations supplied or endorsed by TradingView. Read more in the Terms of Use.
Disclaimer
The information and publications are not meant to be, and do not constitute, financial, investment, trading, or other types of advice or recommendations supplied or endorsed by TradingView. Read more in the Terms of Use.