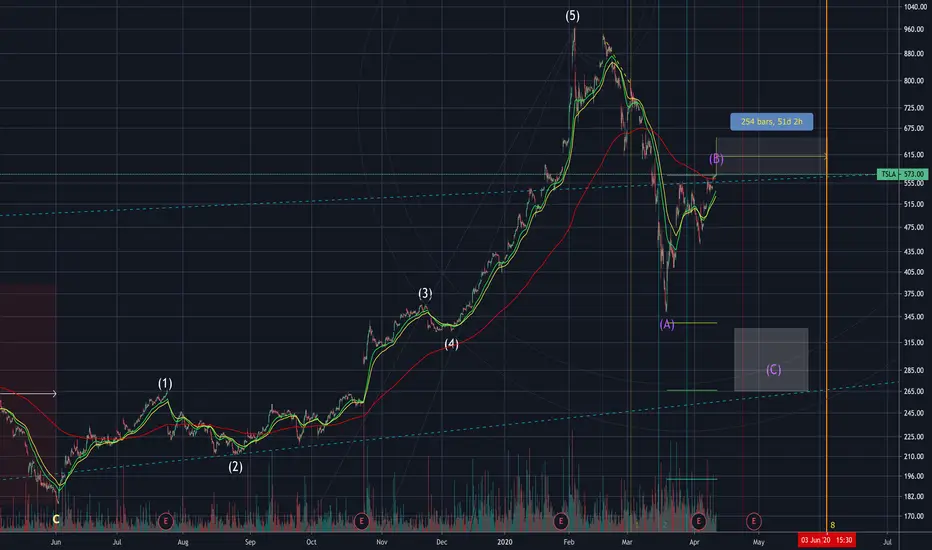
Analysis Method: Fibonacci & Wave Theory
Near-term Target: $330-$265
Wave Count: Intermediate Wave 2
Time-frame: 30-60 days
Monthly Chart (High Wave): Cycle Wave Sequence 1 & 2
Intermediate Wave 1:
Intermediate Wave 2:
Will update.
FMW
Disclaimer
The information and publications are not meant to be, and do not constitute, financial, investment, trading, or other types of advice or recommendations supplied or endorsed by TradingView. Read more in the Terms of Use.
Disclaimer
The information and publications are not meant to be, and do not constitute, financial, investment, trading, or other types of advice or recommendations supplied or endorsed by TradingView. Read more in the Terms of Use.