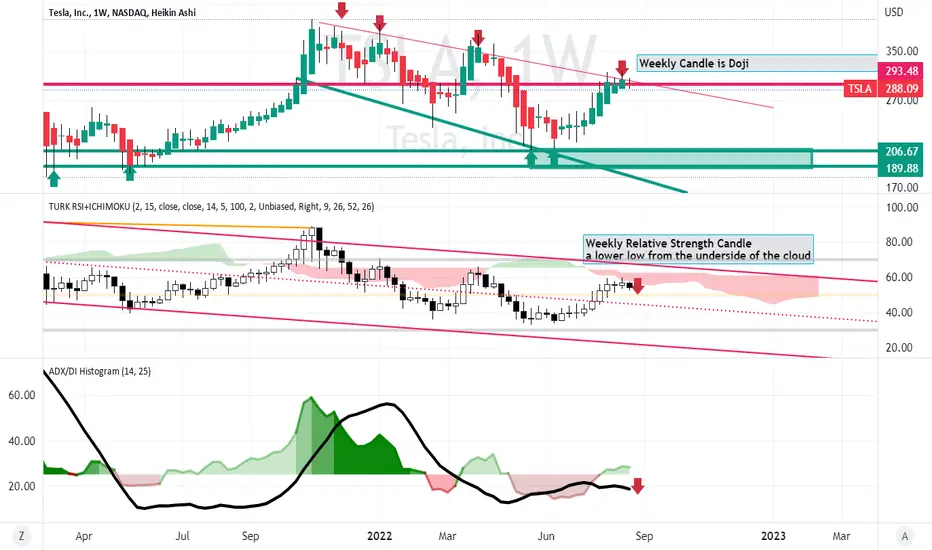
TSLA as shown on the weekly chart
has hit the top of a megaphone pattern ( increasing volatility)
where it printed a Doji candle to demarcate a reversal
while the relative strength topped out testing its Ichimoku Cloud
but failing.
The ADX has little magnitude ( distance from zero) nor rate
of change ( momentum) and is now pointing downward.
All in all, TSLA on the weekly chart is at a bearish inflection
in the context that TESLA has put out more news about impending
layoffs.
Disclaimer
The information and publications are not meant to be, and do not constitute, financial, investment, trading, or other types of advice or recommendations supplied or endorsed by TradingView. Read more in the Terms of Use.
Disclaimer
The information and publications are not meant to be, and do not constitute, financial, investment, trading, or other types of advice or recommendations supplied or endorsed by TradingView. Read more in the Terms of Use.