Hello traders!
If you "Follow" us, you can always get new information quickly.
Please also click “Boost”.
Have a good day.
-------------------------------------
(TSLA chart)

(1M charts)

The key is whether it can receive support and rise in the 208.41-222.64 range.
(1W chart)

If it falls below 208.41, it is expected to fall to around 164.31-180.63.
If it rises above 222.64 and receives support, it is expected to rise to around 274.28.
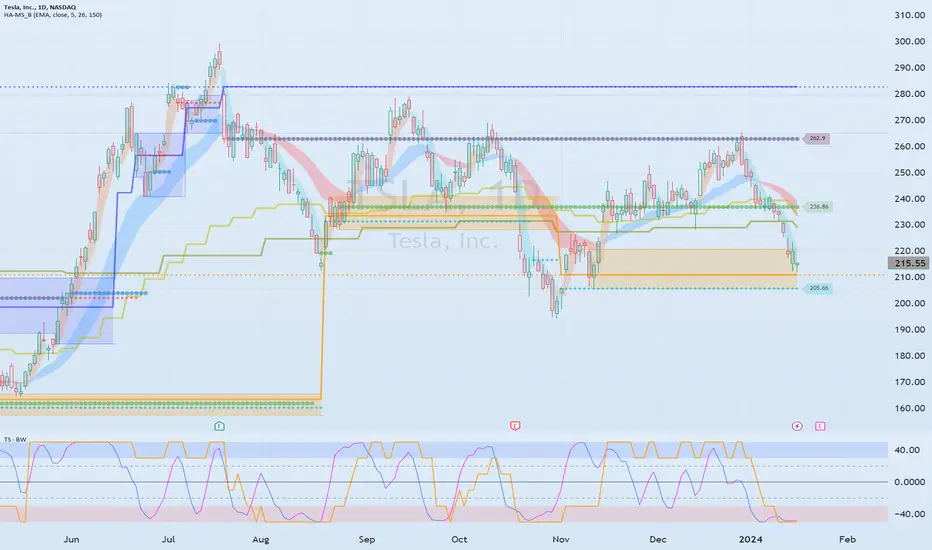
(1D chart)

The key is whether the HA-Low (210.91) indicator can receive support and rise in the box range (205.69-220.80).
If it falls below the HA-Low indicator, it is expected to continue a short-term cascading decline.
To break out of this short-term downtrend, it must rise above 235.45.
Have a good time.
thank you
-------------------------------------------------- -------------------------------------------
** All explanations are for reference only and do not guarantee profit or loss in investment.
** Trading volume is displayed as a candle body based on 10EMA.
How to display (in order from darkest to darkest)
More than 3 times the trading volume of 10EMA > 2.5 times > 2.0 times > 1.25 times > Trading volume below 10EMA
** Even if you know other people’s know-how, it takes a considerable amount of time to make it your own.
** This chart was created using my know-how.
---------------------------------
If you "Follow" us, you can always get new information quickly.
Please also click “Boost”.
Have a good day.
-------------------------------------
(TSLA chart)
(1M charts)
The key is whether it can receive support and rise in the 208.41-222.64 range.
(1W chart)
If it falls below 208.41, it is expected to fall to around 164.31-180.63.
If it rises above 222.64 and receives support, it is expected to rise to around 274.28.
(1D chart)
The key is whether the HA-Low (210.91) indicator can receive support and rise in the box range (205.69-220.80).
If it falls below the HA-Low indicator, it is expected to continue a short-term cascading decline.
To break out of this short-term downtrend, it must rise above 235.45.
Have a good time.
thank you
-------------------------------------------------- -------------------------------------------
** All explanations are for reference only and do not guarantee profit or loss in investment.
** Trading volume is displayed as a candle body based on 10EMA.
How to display (in order from darkest to darkest)
More than 3 times the trading volume of 10EMA > 2.5 times > 2.0 times > 1.25 times > Trading volume below 10EMA
** Even if you know other people’s know-how, it takes a considerable amount of time to make it your own.
** This chart was created using my know-how.
---------------------------------
Note
(COIN 1M chart)We need to see if we can hold the price above 116.30 and move higher.
(1W chart)
If the price maintains by rising above the HA-High indicator (135.80), it is expected to lead to a movement upward above 173.92.
If the price remains above 116.30, I think it is highly likely that the mid- to long-term upward trend will continue.
(1D chart)
If it rises above 173.92, it is expected to break out of the bottom range.
Accordingly, the key is whether it can receive support around 130.78-135.80 and rise above 147.90.
Note
The 164.31-180.63 section is a strong support zone.
Therefore, when it shows support around 164.31-180.63, it is necessary to check whether a new HA-Low indicator is created.
If the HA-Low indicator is created, the important thing is whether it can be supported and rise near it.
Other content (coins, stocks, etc.) is frequently posted on X.
X에 다른 내용(코인, 주식 등)이 자주 게시.
◆ t.me/readCryptoChannel
[HA-MS Indicator]
bit.ly/3YxHgvN
[OBV Indicator]
bit.ly/4dcyny3
X에 다른 내용(코인, 주식 등)이 자주 게시.
◆ t.me/readCryptoChannel
[HA-MS Indicator]
bit.ly/3YxHgvN
[OBV Indicator]
bit.ly/4dcyny3
Disclaimer
The information and publications are not meant to be, and do not constitute, financial, investment, trading, or other types of advice or recommendations supplied or endorsed by TradingView. Read more in the Terms of Use.