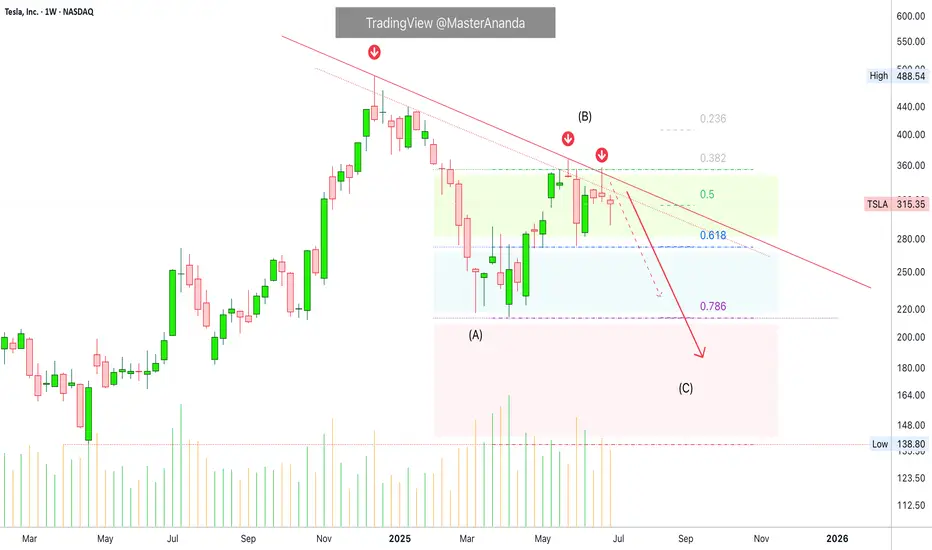
Tesla has been bearish since December 2024 and producing lower highs since. A strong lower high happened late May with a shooting start candlestick pattern. A month later another lower high and bullish rejection with an inverted hammer.
This looks like an ABC correction with the low in March/April being the A wave. The lower high in May the B wave and the next low the final C wave. This would complete the corrective pattern.
Conditions for bullish
An invalidation of the bearish bias and potential would happen with a rise and close, weekly, above 355. Any trading below this number and the bearish bias remains intact.
Indicators: RSI & MACD
» RSI:
The RSI looks pretty bad as it already curved down; trending down and moving lower since December 2024.
» MACD:
The weekly MACD is weak, starting to curve but still on the bullish zone. The daily MACD already turned bearish and moving lower.
Summary
Overall, market conditions are weak for this stock and everything points lower. The chart structure points to a lower low based on a broader bearish trend.
Thank you for reading.
Namaste.
Note
🚨 TOP Results
ETH +2050% · AAVE +1134%
XRP +749% · DOGS +868%
BTC +580% · SOL +687%
t.me/anandatrades/1350
🚨 Analyses & Results
t.me/masteranandatrades/6681
🚨 LIFETIME (Pay for 7, get 1)
lamatrades.com —Since 2017
ETH +2050% · AAVE +1134%
XRP +749% · DOGS +868%
BTC +580% · SOL +687%
t.me/anandatrades/1350
🚨 Analyses & Results
t.me/masteranandatrades/6681
🚨 LIFETIME (Pay for 7, get 1)
lamatrades.com —Since 2017
Related publications
Disclaimer
The information and publications are not meant to be, and do not constitute, financial, investment, trading, or other types of advice or recommendations supplied or endorsed by TradingView. Read more in the Terms of Use.