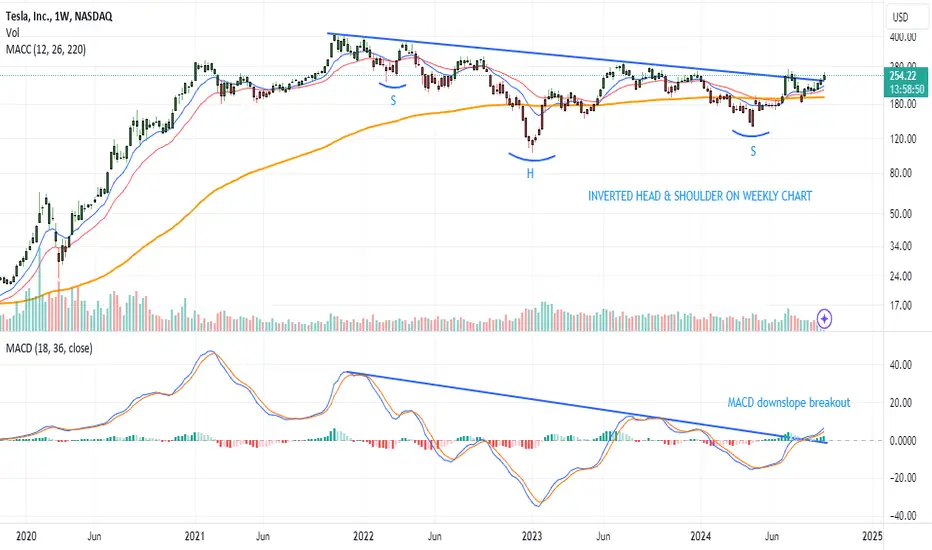
Weekly chart  TSLA . Looks like an inverted H&S to me, and it's just breaking out, making it now a complete one.
MACD also showing bullish sign as it breaks the downtrend line.
Nice R/R setup this one.
MACD also showing bullish sign as it breaks the downtrend line.
Nice R/R setup this one.
Disclaimer
The information and publications are not meant to be, and do not constitute, financial, investment, trading, or other types of advice or recommendations supplied or endorsed by TradingView. Read more in the Terms of Use.
Disclaimer
The information and publications are not meant to be, and do not constitute, financial, investment, trading, or other types of advice or recommendations supplied or endorsed by TradingView. Read more in the Terms of Use.