Market Structure Overview
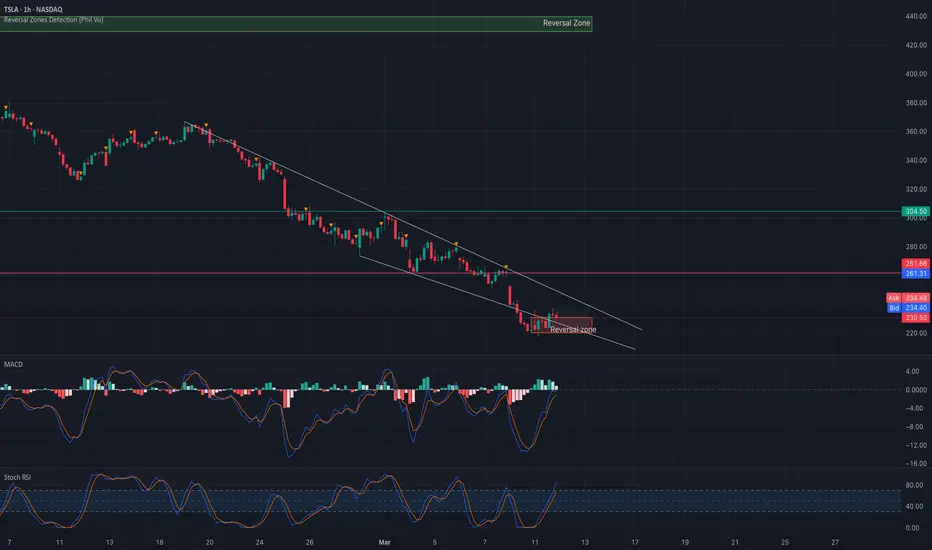
* TSLA has been in a downtrend channel, forming lower highs and lower lows.
* It has now entered a reversal zone, potentially signaling a short-term bottom.
Supply and Demand Zones
* Support Zone: $217 - $230 (Reversal Zone)
* Resistance Levels: $250, $270, and major resistance at $304.50.
Key Technical Observations
* Falling Wedge Pattern: The stock is testing the lower trendline support, indicating a potential breakout.
* MACD Crossover: A possible bullish crossover is forming, suggesting momentum shift.
* Stochastic RSI Oversold: TSLA is rebounding from oversold conditions, indicating potential upside.
GEX Analysis & Option Flow Insights

* IVR: 85.5 (Elevated Implied Volatility Rank)
* IVx Avg: 103.6
* Call Walls (Resistance):
* $250: Moderate resistance
* $270: Strong resistance
* $300: Major breakout level
* Put Walls (Support):
* $217: Strong support
* $200: Extreme support level
Trade Scenarios
Bullish Case (Breakout Above $250)
* Entry: Above $250
* Target 1: $270
* Target 2: $304.50
* Stop-Loss: Below $230
Bearish Case (Breakdown Below $217)
* Entry: Below $217
* Target 1: $200
* Target 2: $190
* Stop-Loss: Above $230
Final Thoughts
TSLA is currently in a high-volatility reversal zone. Watch for a breakout above $250 for confirmation of trend reversal, while a breakdown below $217 would signal further downside.
Disclaimer:
This analysis is for educational purposes only and does not constitute financial advice. Always perform your own due diligence before making trading decisions.
* TSLA has been in a downtrend channel, forming lower highs and lower lows.
* It has now entered a reversal zone, potentially signaling a short-term bottom.
Supply and Demand Zones
* Support Zone: $217 - $230 (Reversal Zone)
* Resistance Levels: $250, $270, and major resistance at $304.50.
Key Technical Observations
* Falling Wedge Pattern: The stock is testing the lower trendline support, indicating a potential breakout.
* MACD Crossover: A possible bullish crossover is forming, suggesting momentum shift.
* Stochastic RSI Oversold: TSLA is rebounding from oversold conditions, indicating potential upside.
GEX Analysis & Option Flow Insights
* IVR: 85.5 (Elevated Implied Volatility Rank)
* IVx Avg: 103.6
* Call Walls (Resistance):
* $250: Moderate resistance
* $270: Strong resistance
* $300: Major breakout level
* Put Walls (Support):
* $217: Strong support
* $200: Extreme support level
Trade Scenarios
Bullish Case (Breakout Above $250)
* Entry: Above $250
* Target 1: $270
* Target 2: $304.50
* Stop-Loss: Below $230
Bearish Case (Breakdown Below $217)
* Entry: Below $217
* Target 1: $200
* Target 2: $190
* Stop-Loss: Above $230
Final Thoughts
TSLA is currently in a high-volatility reversal zone. Watch for a breakout above $250 for confirmation of trend reversal, while a breakdown below $217 would signal further downside.
Disclaimer:
This analysis is for educational purposes only and does not constitute financial advice. Always perform your own due diligence before making trading decisions.
Disclaimer
The information and publications are not meant to be, and do not constitute, financial, investment, trading, or other types of advice or recommendations supplied or endorsed by TradingView. Read more in the Terms of Use.
Disclaimer
The information and publications are not meant to be, and do not constitute, financial, investment, trading, or other types of advice or recommendations supplied or endorsed by TradingView. Read more in the Terms of Use.