🚀  TSLA Weekly Chart Analysis
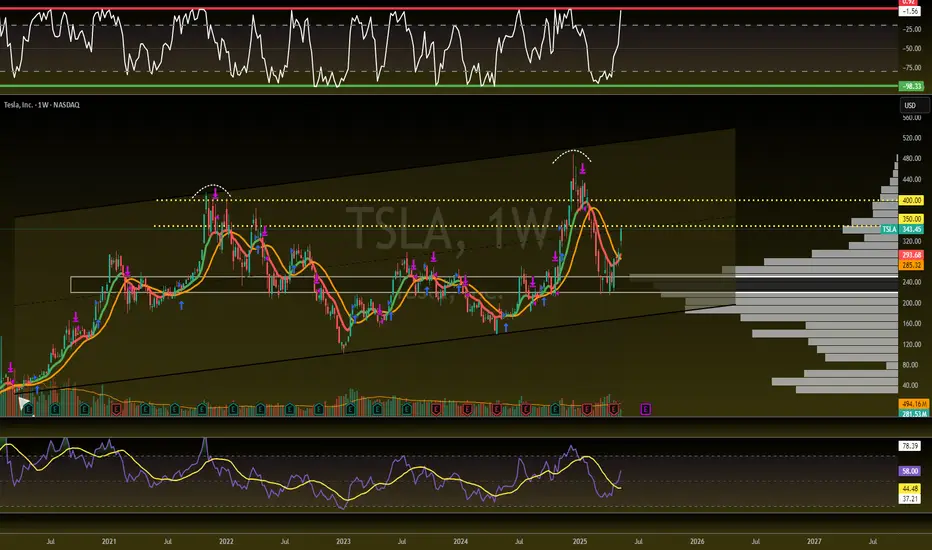
🔹 Strong Momentum: Launching off the volume shelf and cruising with the market’s bullish energy.
🔹 Room to Run: Approaching the red barrier, but not there yet—still has upside before a pullback.
🔹 Healthy RSI: Sitting at 56.60, meaning plenty of room for further gains.
🔹 Catalyst Ahead: Robotaxi event incoming! (Sell the news? You bought the rumor. 🤔)
🔹 Key Resistance: Watch levels at $350–$400.
Stay sharp—let’s see if TSLA keeps charging forward! ⚡📈
🖐️ High Five Strategies
📈 Stocks, Cryptos, ETFs, Levered ETFs
📱 Find me on other Socials
🌆 High Five Community 👇
whop.com/highfive-pro/
📈 Stocks, Cryptos, ETFs, Levered ETFs
📱 Find me on other Socials
🌆 High Five Community 👇
whop.com/highfive-pro/
Disclaimer
The information and publications are not meant to be, and do not constitute, financial, investment, trading, or other types of advice or recommendations supplied or endorsed by TradingView. Read more in the Terms of Use.