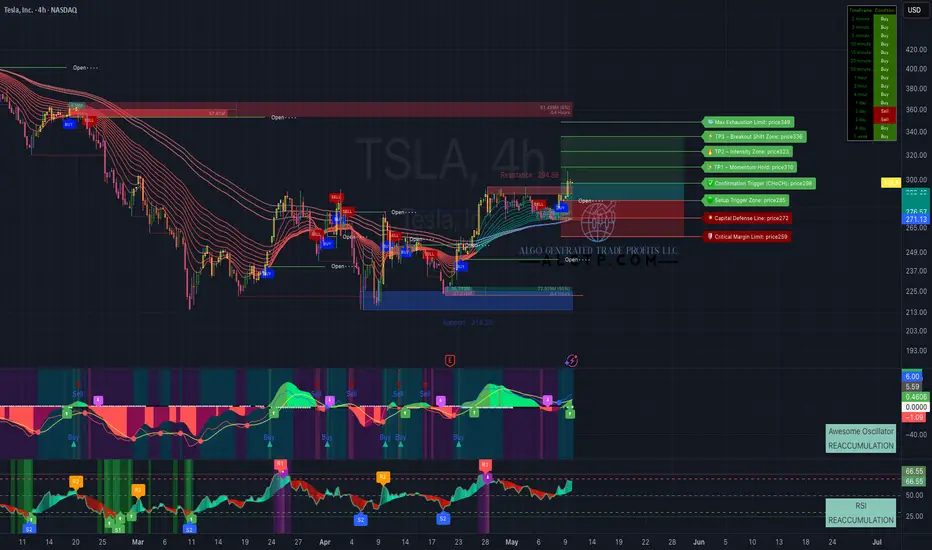
📈 TSLA 4H Chart Analysis – A Confluence of Multiple Technical Patterns
TSLA is currently forming a highly significant confluence zone around the 288 level, acting as a key neckline that's been tested and established over multiple sessions. This isn't just a single pattern at play — it's a combination of several overlapping structures across different perspectives.
🔍 Pattern perspectives observed:
Cup & Base
Cup & Handle
Inverse Head and Shoulders
Multi-VWAP Support Zones
Each pattern aligns differently, but all converge around the 288 price level, making it a critical zone of structural importance.
📊 Supporting momentum and confirmation signals:
RSI has broken above the zero line, showing clear buyer strength
Awesome Oscillator (AO) signals a strong reaccumulation phase
Price has successfully broken out above the 294.86 resistance zone, indicating a shift in trend
Multiple timeframes (2m to 4H) are in full alignment with Buy signals
💬 Conclusion:
TSLA is entering a potential breakout phase, driven by a powerful confluence of technical patterns all meeting at the 288 neckline. With momentum confirmed and buying pressure in control, the probability of TSLA rallying from 288 toward the 360 zone is notably high.
Disclaimer:
This analysis is for informational and educational purposes only and does not constitute financial advice. Trading stocks involves significant risk, and you should only trade with funds you can afford to lose. Always do your own research or consult with a licensed financial advisor before making trading decisions.
ALGTP®
Disclaimer
The information and publications are not meant to be, and do not constitute, financial, investment, trading, or other types of advice or recommendations supplied or endorsed by TradingView. Read more in the Terms of Use.
ALGTP®
Disclaimer
The information and publications are not meant to be, and do not constitute, financial, investment, trading, or other types of advice or recommendations supplied or endorsed by TradingView. Read more in the Terms of Use.