Hello & welcome to this analysis
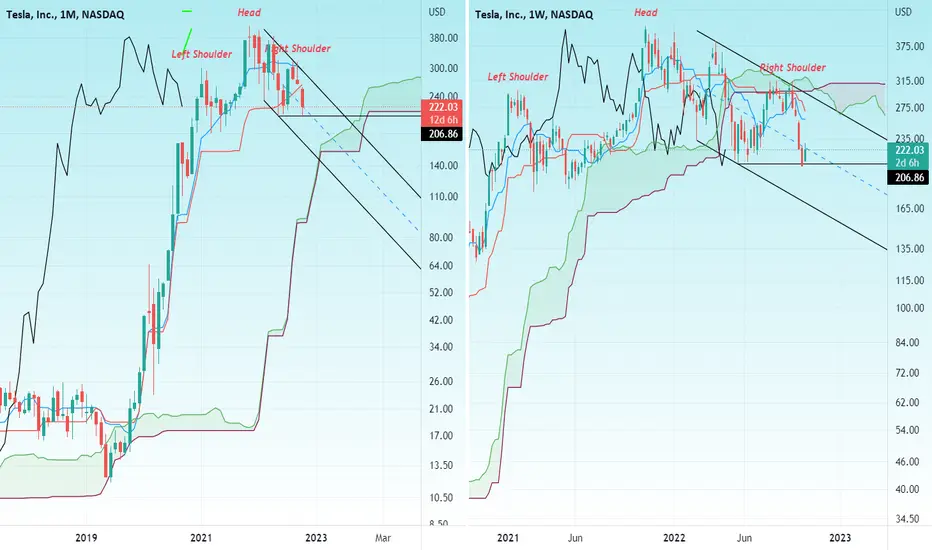
In the monthly time frame we can see the stock has broken and continues to trade below the Ichimoku Base line support, suggesting a likely test of the Ichimoku clouds in the coming months.
In the weekly we can see a Head & Shoulder formation with the right shoulder withing a parallel channel. Sustaining below $205 (weekly) this could break all the way down to $150 before any relief / value buying comes in.
Short term bounces here there might come due to oversold zones, but overall structure has become very bearish for the medium term.
Note
Online courses on Harmonic Trading Patterns, Ichimoku & Trading Psychology Risk Management
t.co/3mGWp29Xkb
t.co/3mGWp29Xkb
Disclaimer
The information and publications are not meant to be, and do not constitute, financial, investment, trading, or other types of advice or recommendations supplied or endorsed by TradingView. Read more in the Terms of Use.