📊 Tesla (TSLA) – VolanX Forecast: The Calm Before the Storm?
Wave structure analysis + liquidity map + roadmap to $513
🧩 The Story So Far – Compressed Potential
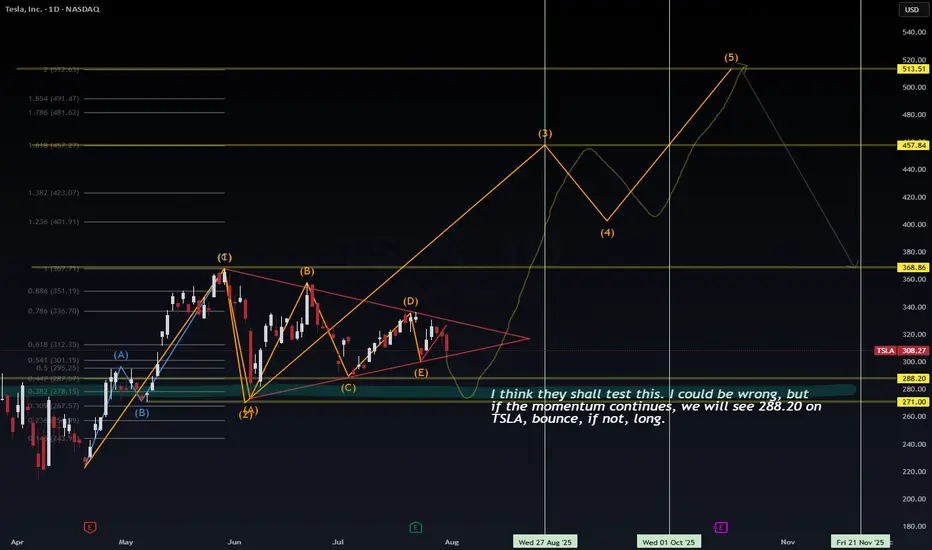
Tesla has spent the past three months inside a contracting triangle (ABCDE) — a classic Elliott Wave corrective pattern that signals energy compression before expansion. From the May high (Wave (1)), price has been coiling within tightening range boundaries, forming lower highs and higher lows. The triangle culminates with leg (E), now hovering near support.
🟠 VolanX flags this as a terminal wedge—an area where institutions test both sides of the book, hunting liquidity.
🌀 Wave Forecast – Impulse Awakening
If the triangle completes as expected, we enter Wave (3)—typically the most explosive wave in Elliott sequences.
Here's how the projected roadmap unfolds:
Wave (2) ends around $288.20–$271.00 (key demand/liquidity zone)
Wave (3) initiates from this springboard, aiming toward:
📈 1.0 Fib Extension at $367.71
📈 1.618 Extension at $457.84
Consolidation expected at that level forms Wave (4)
Final thrust into Wave (5) targets $513.51, aligning with extended Fib projection and historical order block
This sequence respects classical Elliott impulse structure: 5-wave motive into macro target zone.
🧪 Timing & Liquidity – Watch the Clock, Watch the Flow
🗓 Key Windows from chart verticals:
Aug 27–Sep 1, 2025: Liquidity test at $288.20 zone
Oct 1–15, 2025: Expansion toward Wave (3)
By mid-November 2025: Completion of Wave (5) → exhaustion at $513 zone before probable macro retracement
🔍 Liquidity Zones:
$288.20 – Institutional reaccumulation level (VolanX confirms large resting bids)
$271.00 – Final sweep zone. Break below would invalidate bullish count
Above, $336.70–$351.19 is the first liquidity magnet
Major stops above $457.84, then final cluster $513.51
🧠 VolanX Opinion – AI View on Risk & Opportunity
VolanX signals high-probability breakout setup, with confluence across:
Liquidity clusters
Fibonacci symmetry
Elliott sequencing
Gamma positioning (institutional hedging tilts long below $290)
📈 Current predictive bias: 68% probability of breakout from triangle resolving bullishly, conditional on $288 support holding.
If tested and respected, AI favors aggressive repositioning in long gamma, echoing historical TSLA breakout behavior.
📌 Strategy Summary:
“I think they shall test this… I could be wrong. But if momentum holds, $288.20 bounce is likely. If not, wait for structure to rebuild before long.”
🧭 Trade Setup (Not Financial Advice):
Watch zone: $288–271
Confirmation: Strong rejection wick + volume delta flip
Stop: Below $267.57
Targets: $367.71 → $457.84 → $513.51
🔻 Risk comes from invalidation below $271.
⚡ Reward stems from recognizing compression before expansion.
#TSLA #VolanX #ElliottWave #LiquiditySweep #WaveAnalysis #FibonacciLevels #SmartMoney #OptionsFlow #TeslaForecast #AITrading #WaverVanir
Wave structure analysis + liquidity map + roadmap to $513
🧩 The Story So Far – Compressed Potential
Tesla has spent the past three months inside a contracting triangle (ABCDE) — a classic Elliott Wave corrective pattern that signals energy compression before expansion. From the May high (Wave (1)), price has been coiling within tightening range boundaries, forming lower highs and higher lows. The triangle culminates with leg (E), now hovering near support.
🟠 VolanX flags this as a terminal wedge—an area where institutions test both sides of the book, hunting liquidity.
🌀 Wave Forecast – Impulse Awakening
If the triangle completes as expected, we enter Wave (3)—typically the most explosive wave in Elliott sequences.
Here's how the projected roadmap unfolds:
Wave (2) ends around $288.20–$271.00 (key demand/liquidity zone)
Wave (3) initiates from this springboard, aiming toward:
📈 1.0 Fib Extension at $367.71
📈 1.618 Extension at $457.84
Consolidation expected at that level forms Wave (4)
Final thrust into Wave (5) targets $513.51, aligning with extended Fib projection and historical order block
This sequence respects classical Elliott impulse structure: 5-wave motive into macro target zone.
🧪 Timing & Liquidity – Watch the Clock, Watch the Flow
🗓 Key Windows from chart verticals:
Aug 27–Sep 1, 2025: Liquidity test at $288.20 zone
Oct 1–15, 2025: Expansion toward Wave (3)
By mid-November 2025: Completion of Wave (5) → exhaustion at $513 zone before probable macro retracement
🔍 Liquidity Zones:
$288.20 – Institutional reaccumulation level (VolanX confirms large resting bids)
$271.00 – Final sweep zone. Break below would invalidate bullish count
Above, $336.70–$351.19 is the first liquidity magnet
Major stops above $457.84, then final cluster $513.51
🧠 VolanX Opinion – AI View on Risk & Opportunity
VolanX signals high-probability breakout setup, with confluence across:
Liquidity clusters
Fibonacci symmetry
Elliott sequencing
Gamma positioning (institutional hedging tilts long below $290)
📈 Current predictive bias: 68% probability of breakout from triangle resolving bullishly, conditional on $288 support holding.
If tested and respected, AI favors aggressive repositioning in long gamma, echoing historical TSLA breakout behavior.
📌 Strategy Summary:
“I think they shall test this… I could be wrong. But if momentum holds, $288.20 bounce is likely. If not, wait for structure to rebuild before long.”
🧭 Trade Setup (Not Financial Advice):
Watch zone: $288–271
Confirmation: Strong rejection wick + volume delta flip
Stop: Below $267.57
Targets: $367.71 → $457.84 → $513.51
🔻 Risk comes from invalidation below $271.
⚡ Reward stems from recognizing compression before expansion.
#TSLA #VolanX #ElliottWave #LiquiditySweep #WaveAnalysis #FibonacciLevels #SmartMoney #OptionsFlow #TeslaForecast #AITrading #WaverVanir
Disclaimer
The information and publications are not meant to be, and do not constitute, financial, investment, trading, or other types of advice or recommendations supplied or endorsed by TradingView. Read more in the Terms of Use.
Disclaimer
The information and publications are not meant to be, and do not constitute, financial, investment, trading, or other types of advice or recommendations supplied or endorsed by TradingView. Read more in the Terms of Use.