Chart Summary:
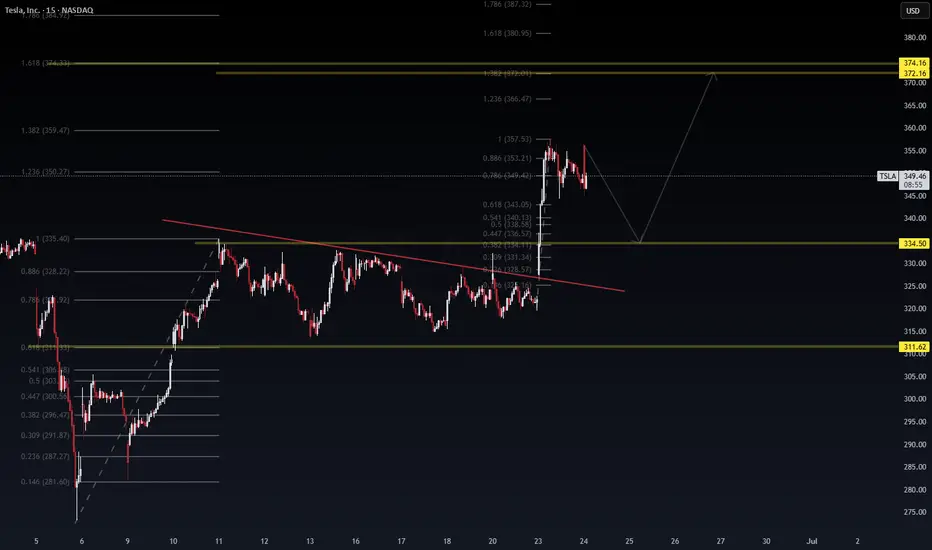
Current Price: ~$349.21
Local Top: ~$357.53 (100% Fib extension)
Bearish Rejection: Notable wick + retrace from 0.886–1.0 zone
Probable Pullback Zone: 343.00–338.50 (Fibonacci 0.618–0.5 retracement)
Major Support Levels:
$334.50 – Prior key horizontal + Fib confluence
$311.62 – Historical demand zone
Projection:
Intraday double-leg correction toward $338–$343
Possible bounce and continuation toward the golden target zone:
$366.47 (1.236 Fib)
$374.16–$380.95 (1.618 zone)
🌍 Macro Alignment
Bullish backdrop:
Tech sector leading broader rally
Tesla’s robotaxi and AI narrative lifting sentiment
Oil down → margin relief for EV production
Catalysts this week: Powell testimony, PCE inflation
📈 Trading Plan
Type Direction Entry Target(s) Stop Loss Confidence
Intraday Bearish $352–$353 rejection zone $343 → $338.5 Above $357.5 🔶 Medium
Swing (Buy the dip) Bullish $338–$334 zone $366.47 → $374.16 Below $330 🟢 Strong
📌 Suggested Strategy
Scalp short if rejection at $353.2–$357.5 confirms with bearish candle on volume.
Add long exposure if price consolidates or reverses from the $338–$334.5 support area.
Monitor Powell’s remarks – Any dovish tilt could accelerate tech upside.
TSLA sentiment remains strong, but intraday shakeouts are expected.
✍️ Summary Signal
“TSLA remains bullish on a swing basis, but intraday looks set for a Fibonacci pullback to $338–$334. Buy dips if structure holds. Macro backdrop (robotaxi + Fed pause) supports continuation to $366–$374.”
Disclaimer
The information and publications are not meant to be, and do not constitute, financial, investment, trading, or other types of advice or recommendations supplied or endorsed by TradingView. Read more in the Terms of Use.
Disclaimer
The information and publications are not meant to be, and do not constitute, financial, investment, trading, or other types of advice or recommendations supplied or endorsed by TradingView. Read more in the Terms of Use.