GEX-Based Option Strategy Insight:
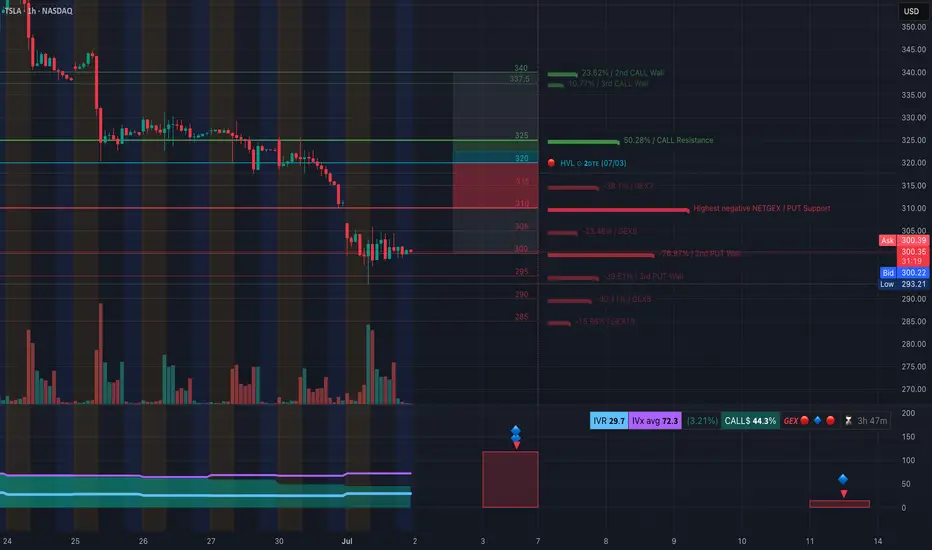
TSLA’s GEX landscape reveals heavy negative Gamma Exposure lurking below $305. That’s a red flag — dealers are likely to short more as price falls, amplifying downside. The highest negative NET GEX zone sits around $310–315, right near the current price, indicating a major PUT support zone — if broken, could trigger a volatility spike.
* PUT Walls: Stack up at $310, $300, $295, with max pain potential down to $285–290.
* Call Walls: Far above at $325/337.5/340 — little gamma resistance above, but TSLA would need a strong reversal to challenge those.
📌 Options Sentiment:
* IVR is 29.7 (lowish), IVx avg is 72.3 → options pricing isn’t cheap anymore.
* Calls 44.3% vs Puts 55.7% → leaning bearish.
* GEX suggests downside acceleration under $300.
➡️ Trade Idea (GEX View): If $300 fails, consider buying 295 or 290 PUTs (weekly or next week expiry). Target $285–290 zone for exit. Above $310 = exit.
1-Hour Chart Technical Setup (2nd image):

TSLA has been in a clear downtrend, marked by:
* Break of Structure (BOS) followed by lower lows.
* Price is hovering inside a potential accumulation zone, but has shown no bullish confirmation yet.
* Volume is weak, and we are still sitting under a steep downtrend resistance line.
📉 Bearish Play:
* Break below $300 = confirmation of continuation.
* Entry: $299.50–300.00
* Target: $293.21 > $290 > $285
* Stop: Close above $305 (tight).
📈 Bullish Risk:
* Only valid if price breaks $310 and flips the BOS area at $317.
* This could trigger a squeeze toward $320/325, but that’s lower probability for now.
Final Thoughts:
Until we reclaim $310+, TSLA leans heavy. GEX confirms dealer pressure below $300. Use tight stops and don’t chase — volatility will increase fast on a breakdown.
Disclaimer: This is not financial advice. Trade at your own risk and always confirm your thesis.
TSLA’s GEX landscape reveals heavy negative Gamma Exposure lurking below $305. That’s a red flag — dealers are likely to short more as price falls, amplifying downside. The highest negative NET GEX zone sits around $310–315, right near the current price, indicating a major PUT support zone — if broken, could trigger a volatility spike.
* PUT Walls: Stack up at $310, $300, $295, with max pain potential down to $285–290.
* Call Walls: Far above at $325/337.5/340 — little gamma resistance above, but TSLA would need a strong reversal to challenge those.
📌 Options Sentiment:
* IVR is 29.7 (lowish), IVx avg is 72.3 → options pricing isn’t cheap anymore.
* Calls 44.3% vs Puts 55.7% → leaning bearish.
* GEX suggests downside acceleration under $300.
➡️ Trade Idea (GEX View): If $300 fails, consider buying 295 or 290 PUTs (weekly or next week expiry). Target $285–290 zone for exit. Above $310 = exit.
1-Hour Chart Technical Setup (2nd image):
TSLA has been in a clear downtrend, marked by:
* Break of Structure (BOS) followed by lower lows.
* Price is hovering inside a potential accumulation zone, but has shown no bullish confirmation yet.
* Volume is weak, and we are still sitting under a steep downtrend resistance line.
📉 Bearish Play:
* Break below $300 = confirmation of continuation.
* Entry: $299.50–300.00
* Target: $293.21 > $290 > $285
* Stop: Close above $305 (tight).
📈 Bullish Risk:
* Only valid if price breaks $310 and flips the BOS area at $317.
* This could trigger a squeeze toward $320/325, but that’s lower probability for now.
Final Thoughts:
Until we reclaim $310+, TSLA leans heavy. GEX confirms dealer pressure below $300. Use tight stops and don’t chase — volatility will increase fast on a breakdown.
Disclaimer: This is not financial advice. Trade at your own risk and always confirm your thesis.
Disclaimer
The information and publications are not meant to be, and do not constitute, financial, investment, trading, or other types of advice or recommendations supplied or endorsed by TradingView. Read more in the Terms of Use.
Disclaimer
The information and publications are not meant to be, and do not constitute, financial, investment, trading, or other types of advice or recommendations supplied or endorsed by TradingView. Read more in the Terms of Use.