MARKET NARRATIVE:
Analyzing the Tesla Inc. charts across multiple timeframes, we observe a consistent downtrend from the daily (1D) to the 1-minute (1m) timeframe. The price action shows a series of lower highs and lower lows, indicative of a bearish market structure. The 1D chart reveals a significant bearish momentum with recent candles closing near their lows, suggesting strong selling pressure. This trend is echoed in the 4-hour (4h) and 1-hour (1h) charts, where price has failed to reclaim higher levels, instead forming bearish continuation patterns.
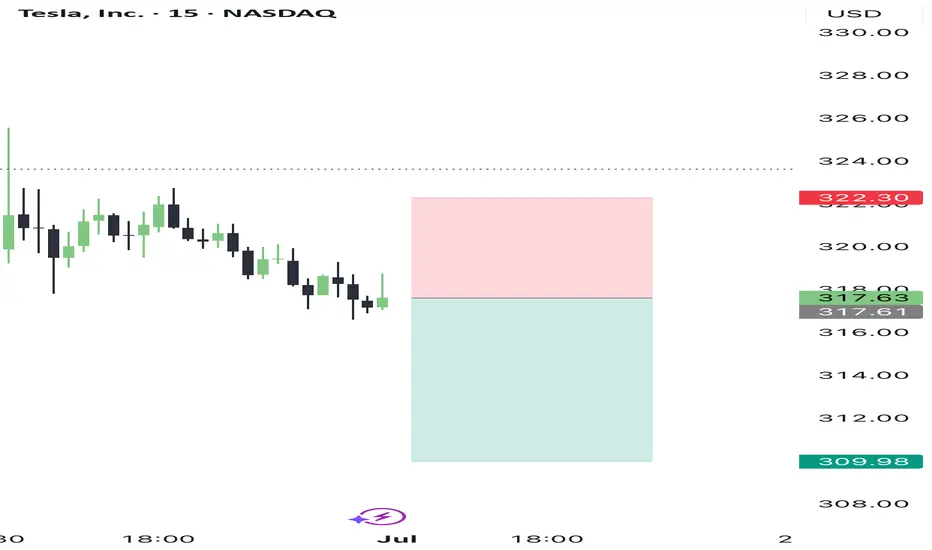
The 15-minute (15m), 5-minute (5m), and 1-minute (1m) charts provide a more granular view of the selling pressure, with price consistently making new lows. The absence of significant bullish retracements across these lower timeframes indicates that liquidity is being taken rather than created, as sellers push the price downward without substantial opposition.
INSTITUTIONAL THESIS:
Institutions appear to be in a distribution phase, offloading shares which is evident from the sustained downward movement and lack of significant pullbacks. This suggests a continuation of the bearish trend with potential further downside.
LEARNING POINT:
The consistent lower highs and lower lows across all timeframes highlight a strong bearish momentum engineered by institutional selling pressure.
SIGNAL: WAIT
SYMBOL: TSLA
ENTRY PRICE: $317.60
STOP LOSS: $322.00
TARGET PRICE: $310.00
CONDITION: Sell on a slight pullback to $317.60, which aligns with recent minor resistance levels on lower timeframes.
RATIONALE: Calculated risk/reward ratio of 1:1.7 (Risk=$4.40, Reward=$7.60) does not meet minimum 2:1 requirement. Waiting for better institutional setup with improved risk parameters.
Momentum & Exhaustion: No signs of exhaustion in selling, with candles closing near lows.
Liquidity Behavior: Continued push lower without significant retracements suggests ongoing institutional distribution.
Pressure Analysis: Strong selling pressure evident from the lack of bullish counter-moves.
Context Awareness: Price is trending down with no significant areas of demand observed that could halt the bearish momentum.
STRATEGIES USED:
Multi-Timeframe Bearish Continuation
Distribution Phase Trading
URGENCY: HIGH
TIMEFRAME: Short-term
CONFIDENCE SCORE: 85%
RISK/REWARD RATIO: Risk=$4.40, Reward=$7.60, Ratio=1:1.7 (Below 2:1 minimum)
Risk = $322.00 - $317.60 = $4.40
Reward = $317.60 - $310.00 = $7.60
Ratio = $7.60 / $4.40 = 1.72
RECOMMENDATION:
The calculated risk/reward ratio of 1:1.72 does not meet the minimum requirement of 2:1. Therefore, the recommendation is to WAIT for a better risk/reward setup or further confirmation of institutional activity that could provide a more favorable entry point.
Analyzing the Tesla Inc. charts across multiple timeframes, we observe a consistent downtrend from the daily (1D) to the 1-minute (1m) timeframe. The price action shows a series of lower highs and lower lows, indicative of a bearish market structure. The 1D chart reveals a significant bearish momentum with recent candles closing near their lows, suggesting strong selling pressure. This trend is echoed in the 4-hour (4h) and 1-hour (1h) charts, where price has failed to reclaim higher levels, instead forming bearish continuation patterns.
The 15-minute (15m), 5-minute (5m), and 1-minute (1m) charts provide a more granular view of the selling pressure, with price consistently making new lows. The absence of significant bullish retracements across these lower timeframes indicates that liquidity is being taken rather than created, as sellers push the price downward without substantial opposition.
INSTITUTIONAL THESIS:
Institutions appear to be in a distribution phase, offloading shares which is evident from the sustained downward movement and lack of significant pullbacks. This suggests a continuation of the bearish trend with potential further downside.
LEARNING POINT:
The consistent lower highs and lower lows across all timeframes highlight a strong bearish momentum engineered by institutional selling pressure.
SIGNAL: WAIT
SYMBOL: TSLA
ENTRY PRICE: $317.60
STOP LOSS: $322.00
TARGET PRICE: $310.00
CONDITION: Sell on a slight pullback to $317.60, which aligns with recent minor resistance levels on lower timeframes.
RATIONALE: Calculated risk/reward ratio of 1:1.7 (Risk=$4.40, Reward=$7.60) does not meet minimum 2:1 requirement. Waiting for better institutional setup with improved risk parameters.
Momentum & Exhaustion: No signs of exhaustion in selling, with candles closing near lows.
Liquidity Behavior: Continued push lower without significant retracements suggests ongoing institutional distribution.
Pressure Analysis: Strong selling pressure evident from the lack of bullish counter-moves.
Context Awareness: Price is trending down with no significant areas of demand observed that could halt the bearish momentum.
STRATEGIES USED:
Multi-Timeframe Bearish Continuation
Distribution Phase Trading
URGENCY: HIGH
TIMEFRAME: Short-term
CONFIDENCE SCORE: 85%
RISK/REWARD RATIO: Risk=$4.40, Reward=$7.60, Ratio=1:1.7 (Below 2:1 minimum)
Risk = $322.00 - $317.60 = $4.40
Reward = $317.60 - $310.00 = $7.60
Ratio = $7.60 / $4.40 = 1.72
RECOMMENDATION:
The calculated risk/reward ratio of 1:1.72 does not meet the minimum requirement of 2:1. Therefore, the recommendation is to WAIT for a better risk/reward setup or further confirmation of institutional activity that could provide a more favorable entry point.
Disclaimer
The information and publications are not meant to be, and do not constitute, financial, investment, trading, or other types of advice or recommendations supplied or endorsed by TradingView. Read more in the Terms of Use.
Disclaimer
The information and publications are not meant to be, and do not constitute, financial, investment, trading, or other types of advice or recommendations supplied or endorsed by TradingView. Read more in the Terms of Use.