The story:
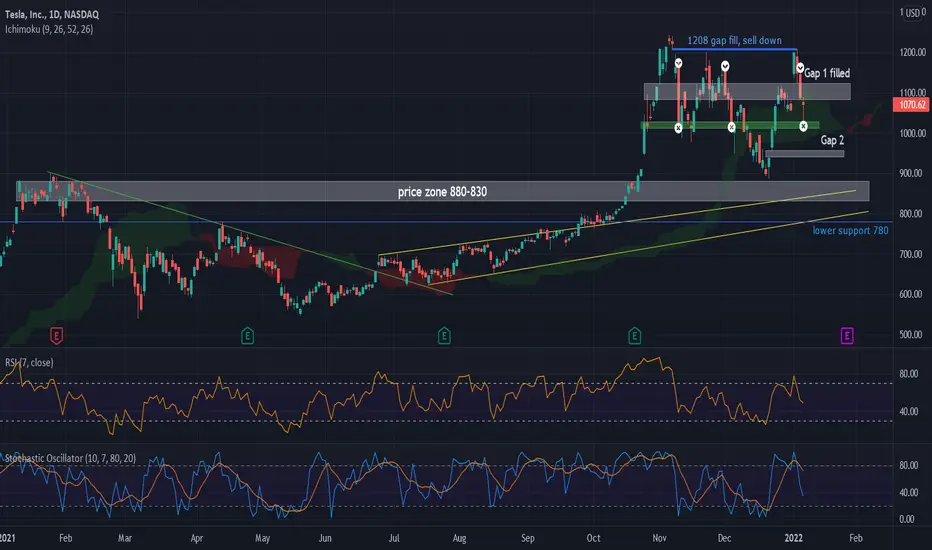
* TSLA started 2021 mostly rangebound between 830-880 and then continued lower for the first half of the year.
* On 24 Jun price went over the green resistance line and started moving up in a channel (yellow lines). It gained momentum, rising over the channel and holding it as support.
* In October, price made a parabolic rise up and has been much more volatile since.
*** When you follow a stock with trendlines, support and resistance notes on chart, you can plan for good trades. Study this TSLA chart and then try your own analyses. Have a basket of stocks that you watch regularly for trading opportunities, and your chart notes will help you identify good setups.
Trading lessons:
* Upper blue line - price filled the gap and exactly touched 1208 before selling ensued. When small fish "bought the news" on 4 Jan, big fish set the sell trade to start at 1208.
* Stock/calls bought on/before 4 Jan should have been sold around 1200.
* Puts bought near 1200 should have been sold (at least partially) when Gap 1 filled.
* Twice you can see price moved from 1170 to 1020-1010 (white circles). Today the green bar held as a bounce zone. Price came down to 1020 again and made a fast 30pt move up. This was a day trade on a 5m chart.
* If Gap 2 fills before earnings, existing price action shows a great entry would be near the top of Gap 1 around 1120. If selling pressure stays high then price may not get over 1080.
*** When trading volatile stocks as this, use little capital, know that computers/algos will move the price, and be aware of bull/bear traps (use partial exits and multiple stop losses)
Options lessons:
* Options have been extremely expensive since October and there is no need to risk capital to chase price moves or "just for the thrill."
* It is prudent with small accounts to buy only 1 option if you desire a trade and be comfortable to hold it. You can take a big percent loss because your real capital loss is small.
* If you buy a weekly option as VIX and IV rise then keep it a day trade. Otherwise your option price can tank as VIX and IV reduce, in addition to normal theta and delta loss.
* If IV and VIX rise are helping your options profit, keep the benefit with at least a partial exit, even if your price target has not been reached.
*** With a good plan and low capital risk, you can hold through wild price swings as long as your trade idea stays intact.
Options trade example (for education):
* I bought one 21Jan 890 put during the last week of December for $8.40. I rarely swing trade on TSLA, but I saw strong indications that price would drop further. Feb monthly expiry was too expensive for me so I bought Jan monthly, thinking price would drop before earnings.
* On Monday as stock soared up on vehicle delivery news, I held my option for 3 reasons: I had time until expiry, I was comfortable with only $840 in the trade, and I saw the 1208 gap as a magnet and also as a double top possibility.
* On 4 Jan this option was priced below $3. My real capital loss was small, though the option was down over 60%.
* On 5 Jan as stock sold off the option gained to over $5. If my trade idea was broken I would have taken this smaller loss. I held the put for further price decline.
* On 6 Jan as price fell again and VIX rose, I sold my option for $12, a 43% gain.
*** In this example, my target price for TSLA was initially 860-850, which would retest the recent low, maybe touch the upper yellow line, and be in the price zone support. Since I am uncertain of how price and IV may fluctuate over the next few days, I sold the option.
Note
11 Jan update - bought TSLA puts near 1070 for another move lower to fill gap 2 (on chart). Using 30min chart to guide trade. First I want to see price reverse from below cloud and move back below 20sma.Trade closed manually
There have been a few good trades based on this chart, and using the 30 and 5 min for timing and entry. Since posting this chart, price bounced from the "X" green zone, and then came down to "gap 2". The 30m chart shows great places to enter and exit trades.Disclaimer
The information and publications are not meant to be, and do not constitute, financial, investment, trading, or other types of advice or recommendations supplied or endorsed by TradingView. Read more in the Terms of Use.
Disclaimer
The information and publications are not meant to be, and do not constitute, financial, investment, trading, or other types of advice or recommendations supplied or endorsed by TradingView. Read more in the Terms of Use.