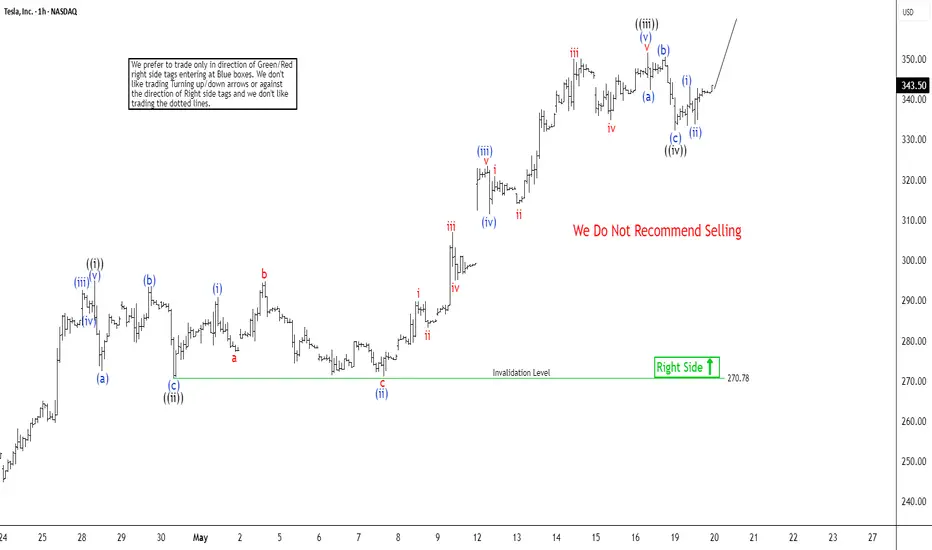
The current price cycle for Tesla (TSLA), starting from its low on April 22, 2025, is unfolding as a five-wave impulse structure, a common pattern in technical analysis signaling strong directional momentum. As illustrated on the 1-hour chart, the stock has been advancing since this low, with distinct waves forming within the broader structure.
From the April 22 low, the first wave, labeled ((i)), peaked at $294.85, followed by a corrective pullback in wave ((ii)) that found support at $270.78. The stock then surged higher in wave ((iii)), demonstrating robust bullish momentum. Within this wave, the internal structure unfolded as follows: wave (i) reached $290.87, followed by a pullback in wave (ii) to $271. The rally resumed in wave (iii), pushing the price to $323.48, before a minor correction in wave (iv) concluded at $311.50. The final leg, wave (v), culminated at $351.52, completing wave ((iii)) of the broader impulse.
Subsequently, a corrective wave ((iv)) unfolded as a zigzag pattern. From the wave ((iii)) peak, wave (a) declined to $342.33, followed by a wave (b) rally to $350.56. The corrective move concluded with wave (c) at $332.29, marking the end of wave ((iv)).
Looking ahead, as long as the price remains above the key support level of $270.78, any near-term pullbacks are likely to attract buyers in a 3, 7, or 11-swing corrective pattern, setting the stage for further upside in the ongoing impulse structure.
14 days trial --> elliottwave-forecast.com/plan-trial/ and get Accurate & timely Elliott Wave Forecasts of 78 instruments. Webinars, Chat Room, Stocks/Forex/Indices Signals & more.
Disclaimer
The information and publications are not meant to be, and do not constitute, financial, investment, trading, or other types of advice or recommendations supplied or endorsed by TradingView. Read more in the Terms of Use.