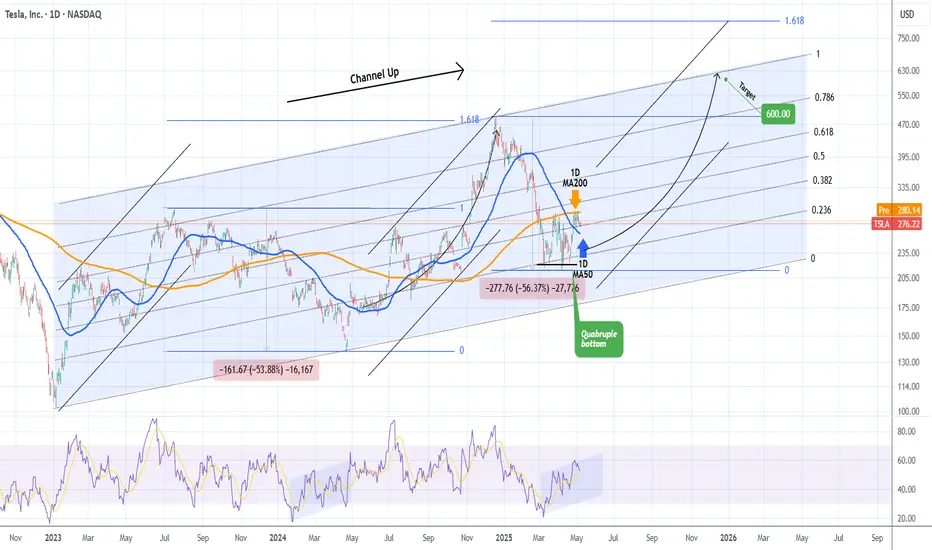
Tesla (TSLA) is seeing a steady recovery from the April 21 2025 Low, which has been a Quadruple Bottom, and has found itself consolidating the last 10 days within the 1D MA200 (orange trend-line) and the 1D MA50 (blue trend-line).
The 2.5 year pattern is a Channel Up and this Quadruple Bottom took place exactly on its 0.236 Fibonacci level, with a 1D RSI sequence that resembles the Bullish Divergence of its previous bottom on April 22 2024. The similarities don't stop there as the Bearish Legs that led to those bottoms have almost been identical (-53.88% and -56.37% respectively).
As a result we can technically assume that the current Bullish Leg that will be confirmed with a break above the 1D MA200, will be symmetrical to the previous one, which made a Higher High on the 1.618 Fibonacci extension from the bottom. That is now at $823 but falls outside of the 2.5-year Channel Up, so our long-term Target for the end of the year is $600, which is right at the top of the pattern.
-------------------------------------------------------------------------------
** Please LIKE 👍, FOLLOW ✅, SHARE 🙌 and COMMENT ✍ if you enjoy this idea! Also share your ideas and charts in the comments section below! This is best way to keep it relevant, support us, keep the content here free and allow the idea to reach as many people as possible. **
-------------------------------------------------------------------------------
💸💸💸💸💸💸
👇 👇 👇 👇 👇 👇
👑Best Signals (Forex/Crypto+70% accuracy) & Account Management (+20% profit/month on 10k accounts)
💰Free Channel t.me/tradingshotglobal
🤵Contact info@tradingshot.com t.me/tradingshot
🔥New service: next X100 crypto GEMS!
💰Free Channel t.me/tradingshotglobal
🤵Contact info@tradingshot.com t.me/tradingshot
🔥New service: next X100 crypto GEMS!
Disclaimer
The information and publications are not meant to be, and do not constitute, financial, investment, trading, or other types of advice or recommendations supplied or endorsed by TradingView. Read more in the Terms of Use.