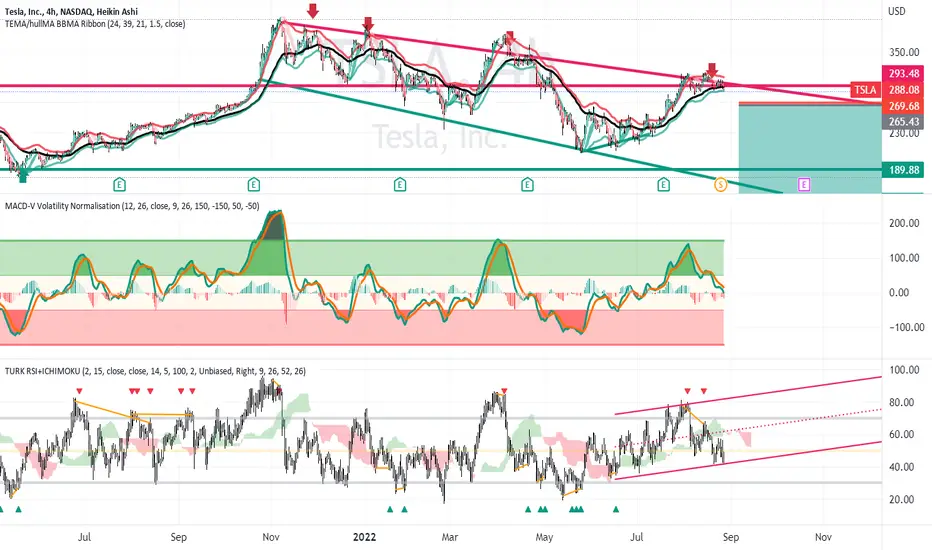
TSLA on the 4 hour chart appears to be in a downtrending parallel
channel and presently at the upper resistance boundary of
the channel. This could also be a megaphone pattern as the channel
is widening a bit as it descends. I see the horizontal resistance of February 2021
market high as resisting any breakout to higher prices.
I see horizontal support below at 190 from the market lows in March and May this year.
The MACD oscillator is in mid-range as is the RSI oscillator. The latter shows
some bearish divergence suggesting an impending reversal.
I see this as a short setup to synergize with the general market
the downturn from the current market price to 190 or until just before
the earnings report in mid-October. This is about $100 of profit
I will set a stop loss of $5 above the current market price Thid
is a great reward-to-risk ratio even if the price gets jammed up
at Fibonacci retracement levels on its way down. The low-costTR bearish ETF
is a consideration as are out of the money put options.
Disclaimer
The information and publications are not meant to be, and do not constitute, financial, investment, trading, or other types of advice or recommendations supplied or endorsed by TradingView. Read more in the Terms of Use.
Disclaimer
The information and publications are not meant to be, and do not constitute, financial, investment, trading, or other types of advice or recommendations supplied or endorsed by TradingView. Read more in the Terms of Use.