Key Technical Levels & Structure
1. 1‑Hour Chart — Uptrend and Resistance
TSLA has been in an ascending channel since April, with recent support around $274–280 on the 4‑h chart
On the 1‑hour, momentum is strong—macros like RSI, MACD, moving averages are all bullish (e.g., the 50‑hour MA is supporting around $330) .
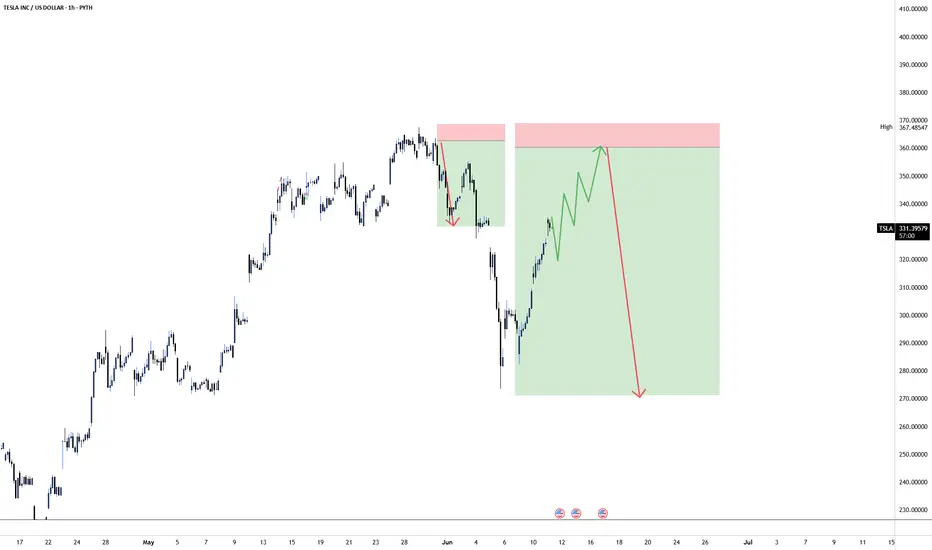
2. Resistance Cluster ~ $357–360
That zone corresponds with prior swing highs and psychological resistance.
A push to $357.82 fits as a logical next target if TSLA maintains this bullish momentum.
3. Liquidity Grab Below
You anticipate a drop from that level to sweep stops and gather buy liquidity—common in breakout strategies.
Price could revisit intraday pivots—like the $330–335 zone or deeper around $320 on drop—which aligns with previous VWAP or double VWAP support regions noted in intraday setups .
1. 1‑Hour Chart — Uptrend and Resistance
TSLA has been in an ascending channel since April, with recent support around $274–280 on the 4‑h chart
On the 1‑hour, momentum is strong—macros like RSI, MACD, moving averages are all bullish (e.g., the 50‑hour MA is supporting around $330) .
2. Resistance Cluster ~ $357–360
That zone corresponds with prior swing highs and psychological resistance.
A push to $357.82 fits as a logical next target if TSLA maintains this bullish momentum.
3. Liquidity Grab Below
You anticipate a drop from that level to sweep stops and gather buy liquidity—common in breakout strategies.
Price could revisit intraday pivots—like the $330–335 zone or deeper around $320 on drop—which aligns with previous VWAP or double VWAP support regions noted in intraday setups .
Looking for powerful AI trading signals? Visit ProSignal.ai and take your trading to the next level! or join our telegram channel at t.me/prosignalai
Disclaimer
The information and publications are not meant to be, and do not constitute, financial, investment, trading, or other types of advice or recommendations supplied or endorsed by TradingView. Read more in the Terms of Use.