Prepare or Avoid the Trap!
🧠 Market Insight:
The recent Trump tariff announcement has shocked the tech and EV sectors, triggering a broad sell-off across growth names. With sentiment rattled and gamma exposure skewing aggressively negative, traders are facing a high-risk, high-opportunity zone. TSLA is now sitting at a critical juncture—with both Smart Money Concepts (SMC) and Options Market positioning flashing red flags. Caution is essential, but opportunity awaits the prepared.
🔍 Technical Analysis (1H Chart):
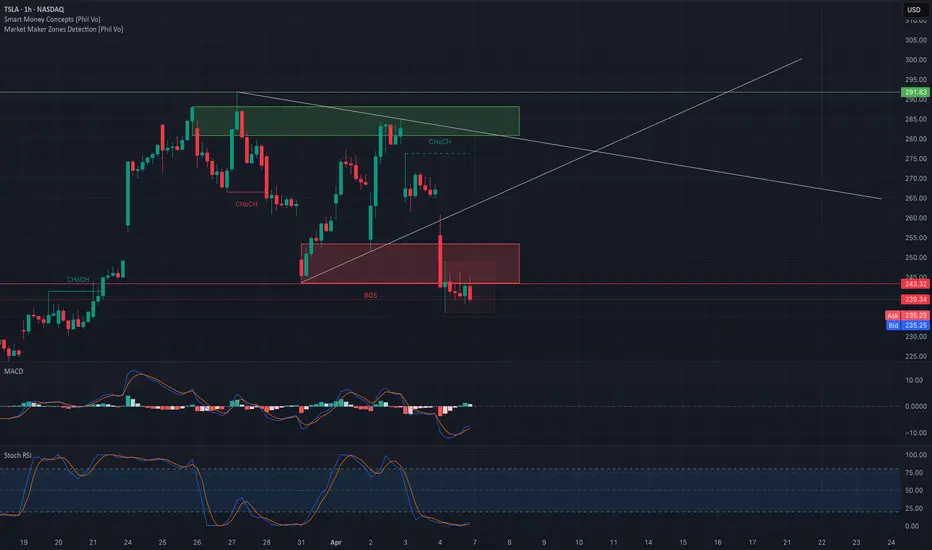
* Break of Structure (BOS) at $243 confirms bearish intent after multiple Chochs.
* Price is holding below a major supply zone ($250–$272), now turned resistance.
* Strong bearish channel structure forming, with price consolidating just below BOS—often a sign of continuation.
* MACD is below the signal line but slightly curling upward—showing potential for a relief bounce.
* Stoch RSI is oversold, indicating exhaustion in short-term bearish momentum. Watch for a bullish crossover.
🔐 Key Levels:
* Resistance: $243.32 (prior BOS), $249.89 (HVL / NETGEX wall), $272.5 (2nd Call Wall).
* Support: $235 zone (current), $222.28 (recent swing low), $215–$210 (GEX danger zone).
💣 Gamma Exposure (GEX) Insights:

* Highest Negative NETGEX at $250 – now acting as a gamma barrier, suggesting strong dealer hedging may suppress rallies.
* Heavy put walls layered down from $235 to $210, with the 2nd PUT Wall (-66.72%) at $215, marking a likely magnetic downside zone.
* IVR: 95.2 with Call$ at 60.5% – Options are still expensive, and call bias may indicate dip-buying interest, but negative GEX outweighs that for now.
📈 Trading Scenarios:
🐻 Bearish Continuation (High Probability):
* Entry: Below $235
* Target: $222 → $215
* Stop: Above $243 BOS
* Reason: Clean break of BOS, trapped longs, negative gamma buildup
🐂 Bullish Reversal (Less Likely – Monitor):
* Entry: Bounce from $235 with strong volume + bullish MACD crossover
* Target: $243 → $249.89
* Stop: Below $230
* Reason: Oversold Stoch RSI + high IV environment may cause volatility pop
💡 Strategy Suggestions:
* Scalpers: Trade between gamma walls, especially $235 to $222 zone with tight stops.
* Swing traders: Wait for reclaim of $243 to consider long.
* Options: Buying puts carries risk due to inflated IV. Consider spreads (put debit or bear call).
⚠️ Final Thoughts:
TSLA has lost key support and sits in a high-volatility, dealer-driven gamma pocket. Directional plays are dangerous unless you're trading with the flow and reacting quickly. Be surgical, respect your stops, and scale into conviction—not noise.
🧨 This analysis is for educational purposes only and does not constitute financial advice. Always do your own research and manage your risk before trading. 🧨
🧠 Market Insight:
The recent Trump tariff announcement has shocked the tech and EV sectors, triggering a broad sell-off across growth names. With sentiment rattled and gamma exposure skewing aggressively negative, traders are facing a high-risk, high-opportunity zone. TSLA is now sitting at a critical juncture—with both Smart Money Concepts (SMC) and Options Market positioning flashing red flags. Caution is essential, but opportunity awaits the prepared.
🔍 Technical Analysis (1H Chart):
* Break of Structure (BOS) at $243 confirms bearish intent after multiple Chochs.
* Price is holding below a major supply zone ($250–$272), now turned resistance.
* Strong bearish channel structure forming, with price consolidating just below BOS—often a sign of continuation.
* MACD is below the signal line but slightly curling upward—showing potential for a relief bounce.
* Stoch RSI is oversold, indicating exhaustion in short-term bearish momentum. Watch for a bullish crossover.
🔐 Key Levels:
* Resistance: $243.32 (prior BOS), $249.89 (HVL / NETGEX wall), $272.5 (2nd Call Wall).
* Support: $235 zone (current), $222.28 (recent swing low), $215–$210 (GEX danger zone).
💣 Gamma Exposure (GEX) Insights:
* Highest Negative NETGEX at $250 – now acting as a gamma barrier, suggesting strong dealer hedging may suppress rallies.
* Heavy put walls layered down from $235 to $210, with the 2nd PUT Wall (-66.72%) at $215, marking a likely magnetic downside zone.
* IVR: 95.2 with Call$ at 60.5% – Options are still expensive, and call bias may indicate dip-buying interest, but negative GEX outweighs that for now.
📈 Trading Scenarios:
🐻 Bearish Continuation (High Probability):
* Entry: Below $235
* Target: $222 → $215
* Stop: Above $243 BOS
* Reason: Clean break of BOS, trapped longs, negative gamma buildup
🐂 Bullish Reversal (Less Likely – Monitor):
* Entry: Bounce from $235 with strong volume + bullish MACD crossover
* Target: $243 → $249.89
* Stop: Below $230
* Reason: Oversold Stoch RSI + high IV environment may cause volatility pop
💡 Strategy Suggestions:
* Scalpers: Trade between gamma walls, especially $235 to $222 zone with tight stops.
* Swing traders: Wait for reclaim of $243 to consider long.
* Options: Buying puts carries risk due to inflated IV. Consider spreads (put debit or bear call).
⚠️ Final Thoughts:
TSLA has lost key support and sits in a high-volatility, dealer-driven gamma pocket. Directional plays are dangerous unless you're trading with the flow and reacting quickly. Be surgical, respect your stops, and scale into conviction—not noise.
🧨 This analysis is for educational purposes only and does not constitute financial advice. Always do your own research and manage your risk before trading. 🧨
Disclaimer
The information and publications are not meant to be, and do not constitute, financial, investment, trading, or other types of advice or recommendations supplied or endorsed by TradingView. Read more in the Terms of Use.
Disclaimer
The information and publications are not meant to be, and do not constitute, financial, investment, trading, or other types of advice or recommendations supplied or endorsed by TradingView. Read more in the Terms of Use.