TSLA – Testing Key Gamma & Structure Levels
Technical Overview
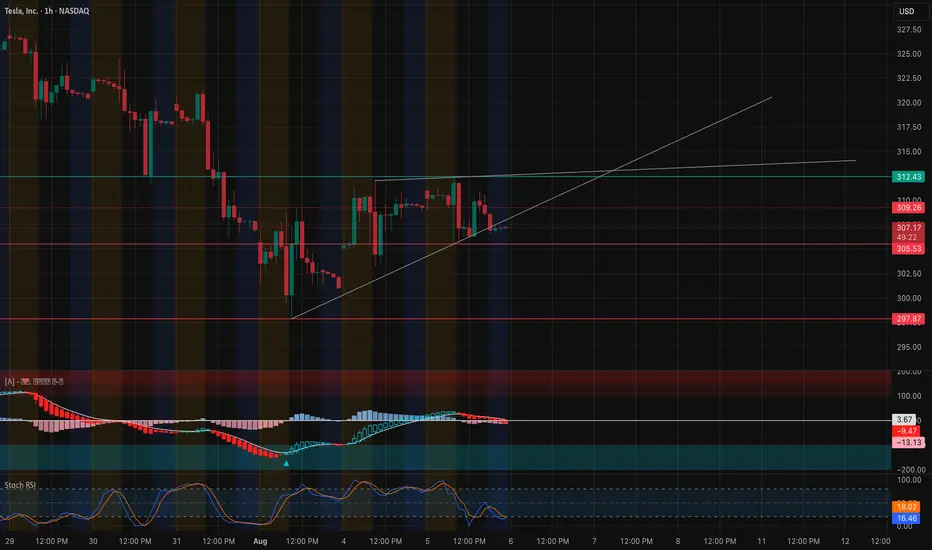
TSLA has been consolidating just under a key resistance zone at 310–312, which also aligns with the highest positive GEX / gamma resistance area. Price is forming a higher-low structure off the 303–305 support trendline, suggesting buyers are still defending key levels despite recent selling pressure. MACD is flattening out and Stoch RSI is cycling near mid-range, indicating a potential momentum build but no confirmed breakout yet.
GEX / Options Sentiment

* Gamma Resistance: Heavy call wall at 312 with 52% concentration, and further stacked resistance into 320–325. This creates a ceiling unless strong bullish momentum steps in.
* Gamma Support: Large put positioning at 300 (-64% concentration) and 295 acting as a key defensive floor.
* Dealer Positioning: Above 312, gamma flip could drive momentum toward 320–325 quickly. Below 300, dealer hedging could accelerate selling into 295 and possibly 290.
Trade Scenarios
Bullish Case
* Trigger: Break & hold above 312 with volume.
* Target 1: 320
* Target 2: 325
* Stop: <305
Bearish Case
* Trigger: Close below 300 with momentum.
* Target 1: 295
* Target 2: 290
* Stop: >312
Options Thoughts
* Bullish: Consider short-term calls if price breaks above 312 with strong volume and momentum confirmation.
* Bearish: Consider puts targeting 300 if rejection occurs at 310–312 and sellers regain control.
* Neutral / Premium Selling: Selling an iron condor around 295–325 could work if expecting continued range trading until a catalyst emerges.
📌 My Take: TSLA is coiling for a decisive move. GEX shows a tight battle between 312 call resistance and 300 put support. A break in either direction could lead to a fast expansion move. I’m leaning neutral-to-bullish as long as 305 holds, but I’ll switch bearish if 300 breaks.
Disclaimer: This analysis is for educational purposes only and not financial advice. Always do your own research and manage risk accordingly.
Technical Overview
TSLA has been consolidating just under a key resistance zone at 310–312, which also aligns with the highest positive GEX / gamma resistance area. Price is forming a higher-low structure off the 303–305 support trendline, suggesting buyers are still defending key levels despite recent selling pressure. MACD is flattening out and Stoch RSI is cycling near mid-range, indicating a potential momentum build but no confirmed breakout yet.
GEX / Options Sentiment
* Gamma Resistance: Heavy call wall at 312 with 52% concentration, and further stacked resistance into 320–325. This creates a ceiling unless strong bullish momentum steps in.
* Gamma Support: Large put positioning at 300 (-64% concentration) and 295 acting as a key defensive floor.
* Dealer Positioning: Above 312, gamma flip could drive momentum toward 320–325 quickly. Below 300, dealer hedging could accelerate selling into 295 and possibly 290.
Trade Scenarios
Bullish Case
* Trigger: Break & hold above 312 with volume.
* Target 1: 320
* Target 2: 325
* Stop: <305
Bearish Case
* Trigger: Close below 300 with momentum.
* Target 1: 295
* Target 2: 290
* Stop: >312
Options Thoughts
* Bullish: Consider short-term calls if price breaks above 312 with strong volume and momentum confirmation.
* Bearish: Consider puts targeting 300 if rejection occurs at 310–312 and sellers regain control.
* Neutral / Premium Selling: Selling an iron condor around 295–325 could work if expecting continued range trading until a catalyst emerges.
📌 My Take: TSLA is coiling for a decisive move. GEX shows a tight battle between 312 call resistance and 300 put support. A break in either direction could lead to a fast expansion move. I’m leaning neutral-to-bullish as long as 305 holds, but I’ll switch bearish if 300 breaks.
Disclaimer: This analysis is for educational purposes only and not financial advice. Always do your own research and manage risk accordingly.
Disclaimer
The information and publications are not meant to be, and do not constitute, financial, investment, trading, or other types of advice or recommendations supplied or endorsed by TradingView. Read more in the Terms of Use.
Disclaimer
The information and publications are not meant to be, and do not constitute, financial, investment, trading, or other types of advice or recommendations supplied or endorsed by TradingView. Read more in the Terms of Use.