TSM (Taiwan Semiconductor)-Breakout Play with Strong Fundamenta
Ticker: TSM (NYSE)
Recommendation: BUY
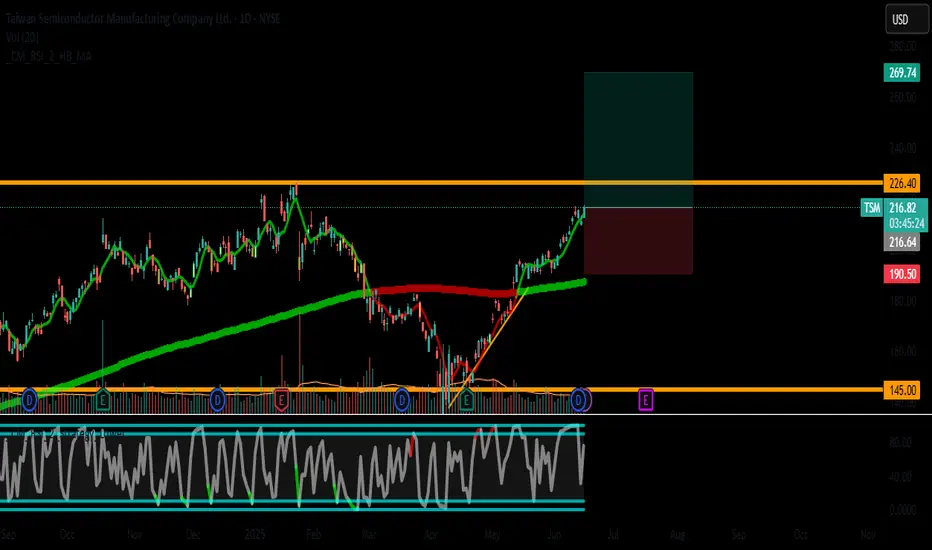
Current Price: $216.62
Entry Zone: $216 - $218 (Breakout confirmation)
Stop Loss: $190 (Key support level, -12.3% from entry)
Take Profit: $270.04 (+24.7% upside)
Risk/Reward Ratio: 1:2
📈 Technical Analysis
Trend: Strong bullish momentum across all timeframes (Daily/4H/1H).
Key Levels:
Support: $200 (SMA-50), $190 (Major swing low).
Resistance: $218 (Bollinger High), $270 (Fibonacci extension).
Indicators:
RSI (Daily): 72.98 (Approaching overbought but with room to run in strong trends).
MACD: Bullish crossover, positive momentum.
Volume: Rising on upward moves, confirming buyer interest.
💡 Fundamental Catalyst
Strong Growth: Revenue +33.8% YoY, Net Income +36% YoY.
Undervalued Metrics: P/S Ratio of 0.35 (Sector avg: ~5.0).
Low Debt: Debt-to-Equity of 0.22, Interest Coverage Ratio of 174x.
🎯 Why This Trade?
Breakout Potential: TSM is testing multi-week highs with volume support.
Semiconductor Sector Strength: NVDA/AMD leading sector rally, TSM as a key supplier.
High Reward/Risk: Clear SL level with 2x upside potential.
⚡ Trade Management
Add-on: Consider adding at $225 if momentum continues.
Trailing Stop: Move SL to breakeven at $220 if price reaches $240.
Watchlist: Monitor NASDAQ/SOX index correlation.
📉 Risks:
Broad market pullback.
Geopolitical tensions (Taiwan exposure).
✅ Verdict: TSM combines technical breakout strength with undervalued fundamentals. A high-conviction trade for swing traders.
Like & Follow for more data-driven ideas! 🔥
#TSM #Semiconductors #Breakout #Investing
Recommendation: BUY
Current Price: $216.62
Entry Zone: $216 - $218 (Breakout confirmation)
Stop Loss: $190 (Key support level, -12.3% from entry)
Take Profit: $270.04 (+24.7% upside)
Risk/Reward Ratio: 1:2
📈 Technical Analysis
Trend: Strong bullish momentum across all timeframes (Daily/4H/1H).
Key Levels:
Support: $200 (SMA-50), $190 (Major swing low).
Resistance: $218 (Bollinger High), $270 (Fibonacci extension).
Indicators:
RSI (Daily): 72.98 (Approaching overbought but with room to run in strong trends).
MACD: Bullish crossover, positive momentum.
Volume: Rising on upward moves, confirming buyer interest.
💡 Fundamental Catalyst
Strong Growth: Revenue +33.8% YoY, Net Income +36% YoY.
Undervalued Metrics: P/S Ratio of 0.35 (Sector avg: ~5.0).
Low Debt: Debt-to-Equity of 0.22, Interest Coverage Ratio of 174x.
🎯 Why This Trade?
Breakout Potential: TSM is testing multi-week highs with volume support.
Semiconductor Sector Strength: NVDA/AMD leading sector rally, TSM as a key supplier.
High Reward/Risk: Clear SL level with 2x upside potential.
⚡ Trade Management
Add-on: Consider adding at $225 if momentum continues.
Trailing Stop: Move SL to breakeven at $220 if price reaches $240.
Watchlist: Monitor NASDAQ/SOX index correlation.
📉 Risks:
Broad market pullback.
Geopolitical tensions (Taiwan exposure).
✅ Verdict: TSM combines technical breakout strength with undervalued fundamentals. A high-conviction trade for swing traders.
Like & Follow for more data-driven ideas! 🔥
#TSM #Semiconductors #Breakout #Investing
Disclaimer
The information and publications are not meant to be, and do not constitute, financial, investment, trading, or other types of advice or recommendations supplied or endorsed by TradingView. Read more in the Terms of Use.
Disclaimer
The information and publications are not meant to be, and do not constitute, financial, investment, trading, or other types of advice or recommendations supplied or endorsed by TradingView. Read more in the Terms of Use.