** long term forecast, the months ahead **
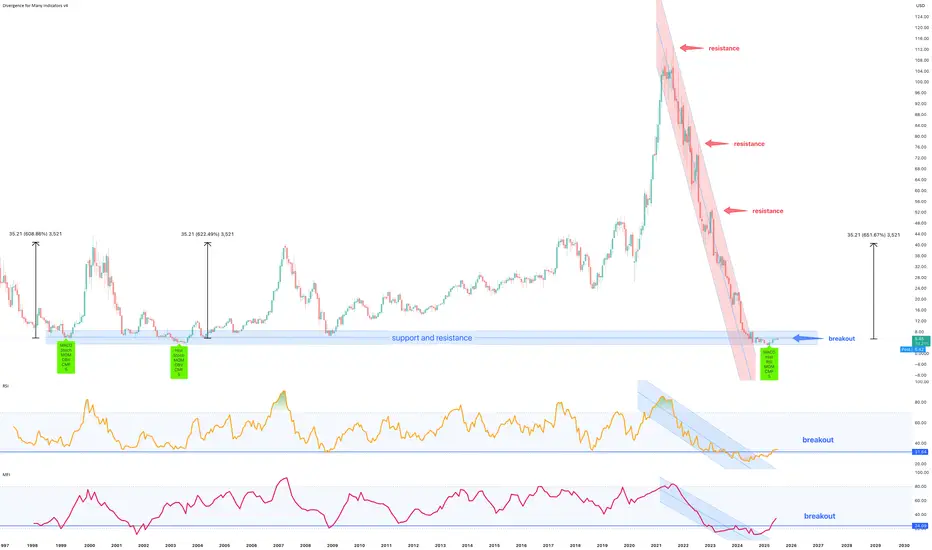
A 97% correction is shown on the above 16 day chart. As of 2021 price action has collapsed from $112 to circa $5 today. A number of reasons now exist for a bullish outlook.
Support and resistance
The trend
Positive divergence
The Stock
Fundamentals
Is it possible price action continues to correct? Sure.
Is it probable? No
Ww
A 97% correction is shown on the above 16 day chart. As of 2021 price action has collapsed from $112 to circa $5 today. A number of reasons now exist for a bullish outlook.
Support and resistance
Price action, Relative Strength Index (RSI), and Money Flow Index both print resistance breakouts.
Look left. Price action is now on legacy support from 1999, 2003, and 2009 market bottoms. This is not the place to be a seller.
The trend
Something interesting in the RSI and MFI (orange and pink lines below chart). They are showing signs of a trend reversal, with higher highs and lower low prints after the breakouts. Exactly what happened in 1999, 2003, and 2009. A deja vu moment.
Positive divergence
Multiple oscillators print positive divergence with price action. Ready to be dazzled? Not only multiple oscillators as in previous years but the same oscillators!
The Stock
Two notes of interest,
1. No share splits.
2. Short interest 18%
Fundamentals
If you’re not chasing businesses who seek to implement AI into their operations, then you’re going to be miss out on some of the best returns in the years ahead. Crypto currency was yesterday, now in decline and dying. Today the narrative is AI, follow the money.
Is it possible price action continues to correct? Sure.
Is it probable? No
Ww
Trade active
Active on publication.BTC
bc1q2eckdzh0q8vsd7swcc8et6ze7s99khhxyl7zwy
Weblink: patreon.com/withoutworries
Allow 3-6 months on ideas. Not investment advice. DYOR
bc1q2eckdzh0q8vsd7swcc8et6ze7s99khhxyl7zwy
Weblink: patreon.com/withoutworries
Allow 3-6 months on ideas. Not investment advice. DYOR
Disclaimer
The information and publications are not meant to be, and do not constitute, financial, investment, trading, or other types of advice or recommendations supplied or endorsed by TradingView. Read more in the Terms of Use.
BTC
bc1q2eckdzh0q8vsd7swcc8et6ze7s99khhxyl7zwy
Weblink: patreon.com/withoutworries
Allow 3-6 months on ideas. Not investment advice. DYOR
bc1q2eckdzh0q8vsd7swcc8et6ze7s99khhxyl7zwy
Weblink: patreon.com/withoutworries
Allow 3-6 months on ideas. Not investment advice. DYOR
Disclaimer
The information and publications are not meant to be, and do not constitute, financial, investment, trading, or other types of advice or recommendations supplied or endorsed by TradingView. Read more in the Terms of Use.