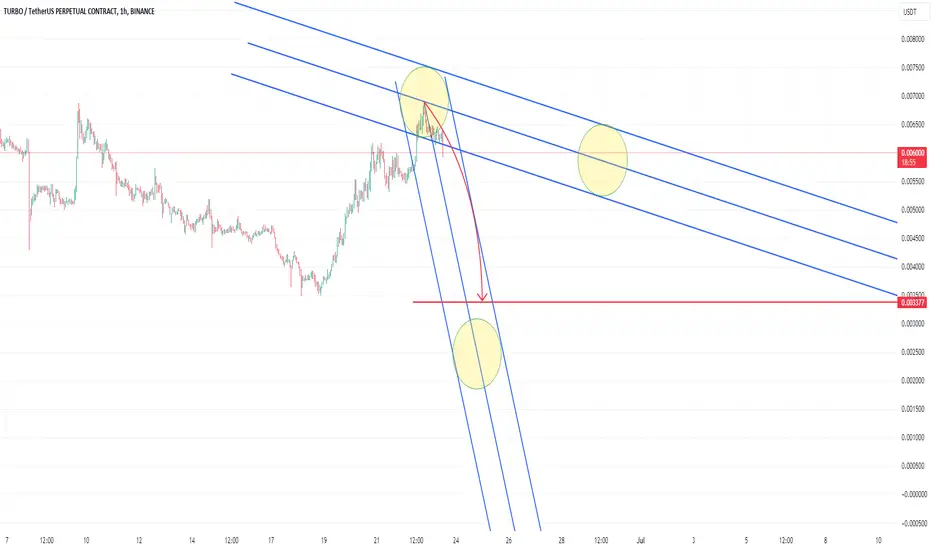
Turbo chart.
This is done using an experimental method based on Da Vinci research I have done over a lot of years.
In theory the price should dump to the point indicated by the red line. Once it goes to the side and on top of it there is the potential of reversal. Ideal targets are at the circles also
This is not financial advice
Disclaimer
The information and publications are not meant to be, and do not constitute, financial, investment, trading, or other types of advice or recommendations supplied or endorsed by TradingView. Read more in the Terms of Use.
Disclaimer
The information and publications are not meant to be, and do not constitute, financial, investment, trading, or other types of advice or recommendations supplied or endorsed by TradingView. Read more in the Terms of Use.