🧩 Overview
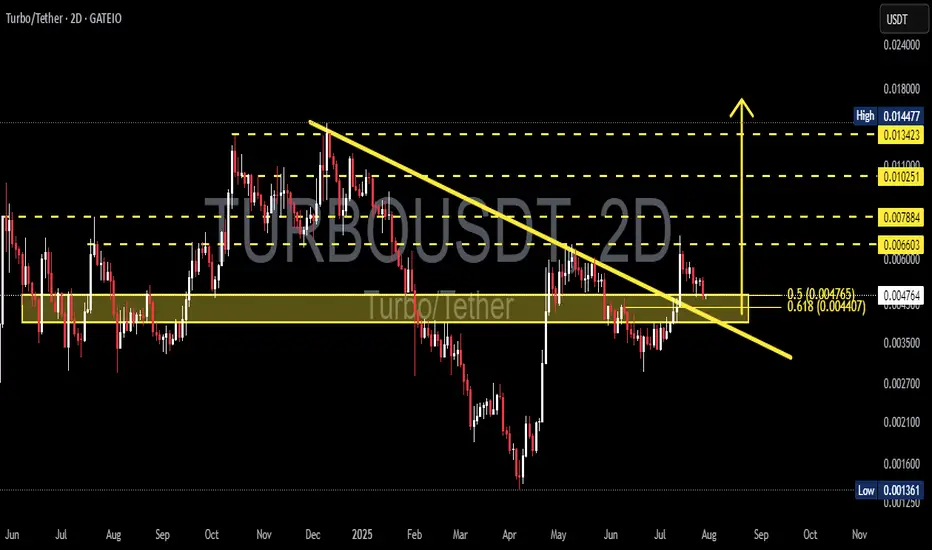
TURBO/USDT is currently sitting at a decisive technical juncture. After a prolonged downtrend since its late 2024 peak, the price has recently shown signs of a momentum shift by breaking out from a major descending trendline. The key question now: Is this the beginning of a bullish reversal, or just a temporary fakeout?
---
📉 Pattern Breakdown
Descending Triangle Breakout (Confirmed)
This classical bearish continuation pattern had formed since November 2024 with consistent lower highs. The recent breakout to the upside suggests a shift in market sentiment.
Historical Accumulation Zone (Demand Zone)
The yellow horizontal box (around 0.0042 – 0.0047 USDT) has acted as a strong historical accumulation and reaction area.
Golden Pocket Retest (Fibonacci 0.5 – 0.618)
The price is currently retesting the golden pocket retracement zone, which often acts as a decision zone for institutional buyers and swing traders.
---
📈 Bullish Scenario (Breakout Confirmation)
If the price holds above the golden pocket zone and prints a higher low, we could see:
🎯 Next Bullish Targets:
0.00660 USDT – Minor resistance
0.00788 USDT – Psychological level
0.01025 USDT – Mid-range resistance
0.01342 USDT – Major key level before recent highs
0.01447 USDT – Local high and full breakout target
✅ Bullish Confirmation:
A strong 2D candle close above 0.0066 with rising volume would validate the bullish breakout and signal continuation.
---
📉 Bearish Scenario (Fakeout Risk)
If price fails to hold the 0.0044 – 0.0047 USDT range and breaks back down:
🔻 Bearish Targets:
0.0035 USDT – Previous local support
0.0025 USDT – Old consolidation zone
0.00136 USDT – All-time low (last defense level)
❗️Bearish Confirmation:
A breakdown below 0.0044 USDT with bearish volume would invalidate the breakout and open the door for deeper downside.
---
🧠 Additional Insights
The initial breakout had solid volume, but current price action is testing the breakout validity.
RSI or momentum indicators (not shown here) should be monitored for divergence or confluence with this setup.
---
📌 Conclusion
> TURBO/USDT is at a make-or-break moment. While the breakout from the descending triangle is a strong bullish signal, the retest of the golden pocket zone must hold to confirm the trend reversal. Failure to do so could turn this into a bull trap with deeper downside risk.
⏳ Eyes on this level — market is choosing a direction.
#TURBO #USDT #CryptoAnalysis #BreakoutOrFakeout #TechnicalAnalysis #DescendingTriangle #FibonacciGoldenPocket #BullishScenario #BearishScenario #AltcoinWatch #CryptoTrading
✅ Get Free Signals! Join Our Telegram Channel Here: t.me/TheCryptoNuclear
✅ Twitter: twitter.com/crypto_nuclear
✅ Join Bybit : partner.bybit.com/b/nuclearvip
✅ Benefits : Lifetime Trading Fee Discount -50%
✅ Twitter: twitter.com/crypto_nuclear
✅ Join Bybit : partner.bybit.com/b/nuclearvip
✅ Benefits : Lifetime Trading Fee Discount -50%
Disclaimer
The information and publications are not meant to be, and do not constitute, financial, investment, trading, or other types of advice or recommendations supplied or endorsed by TradingView. Read more in the Terms of Use.