As long as Bitcoin(
 BTCUSDT) and Ethereum(
 ETHUSDT) are in a range, it is a good opportunity to take advantage of the movement of other tokens and take a look at their charts.
Today, I want to analyze the Threshold( TUSDT) project for you, which has increased by +70%.
What Is the Threshold Network?
Threshold Network is a decentralized protocol that combines cryptography and privacy to power secure, permissionless applications. It enables users to protect their digital assets through threshold cryptography—where no single party has full control—supporting use cases like private key custody, privacy-preserving smart contracts, and tokenized Bitcoin on Ethereum (via tBTC).
Reasons for Price Increase:
Token Buybacks: Threshold Network is actively buying back T tokens from the market, potentially increasing demand and positively impacting the token's price.
Halting Treasury Sales: The project has stopped selling T tokens from its treasury, signaling confidence in the token's future value and reducing potential market supply.
BitcoinWorld
Reducing Operational Expenses: By streamlining operations to save costs, the project aims for long-term sustainability in the volatile crypto landscape.
-----------------------------------------------------
Technical Analysis:
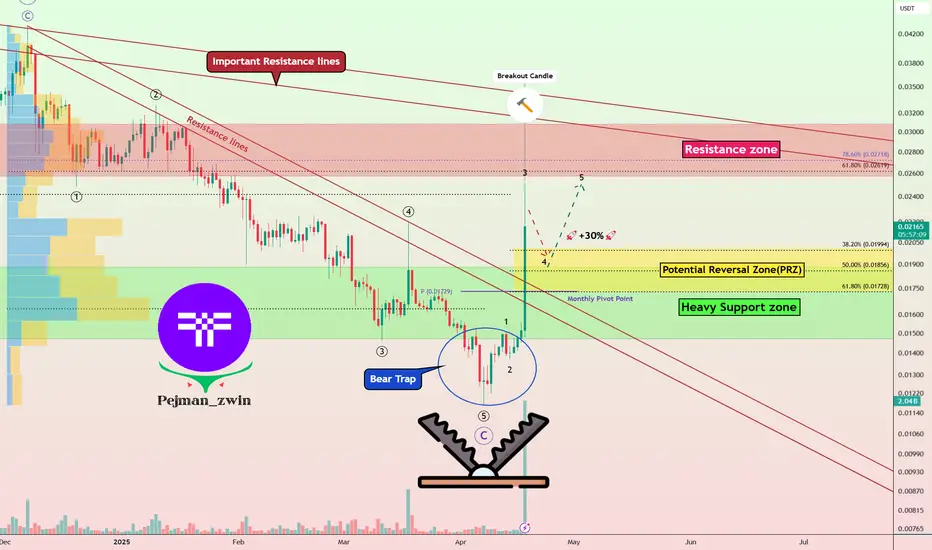
Now let's take a look at the Threshold(T) chart on the Daily timeframe.
Can we still take advantage of the increase in the price of T Token or not!? Please Stay with me.
The Threshold(T) project is moving near the Heavy Support zone($0.0189-$0.0147) and has managed to break the Resistance lines with a high-volume candle, which could be good news for the continuation of the T token's bullish trend.
The Threshold(T) Project also created a Bear Trap, which basically moves in the opposite direction of the Trap after traps on the price chart with high momentum, which is what happened here as well.
In terms of Elliott Wave theory, the T token is currently completing 5 impulsive waves after completing a Zigzag Correction(ABC/5-3-5), which seems like we should wait for the main wave 4 and then a re-increase.
I expect the T token to start rising again from the Potential Reversal Zone(PRZ) [$0.0200-$0.0173]and give us at least +30% profit opportunity.
Note: If the T token goes below $0.016, we should expect further decline and possibly a break of the Heavy Support zone($0.0189-$0.0147).
Please respect each other's ideas and express them politely if you agree or disagree.
Threshold Analyze (TUSDT), Daily time frame.
Be sure to follow the updated ideas.
Do not forget to put a Stop loss for your positions (For every position you want to open).
Please follow your strategy and updates; this is just my Idea, and I will gladly see your ideas in this post.
Please do not forget the ✅' like'✅ button 🙏😊 & Share it with your friends; thanks, and Trade safe.
Today, I want to analyze the Threshold(
What Is the Threshold Network?
Threshold Network is a decentralized protocol that combines cryptography and privacy to power secure, permissionless applications. It enables users to protect their digital assets through threshold cryptography—where no single party has full control—supporting use cases like private key custody, privacy-preserving smart contracts, and tokenized Bitcoin on Ethereum (via tBTC).
Reasons for Price Increase:
Token Buybacks: Threshold Network is actively buying back T tokens from the market, potentially increasing demand and positively impacting the token's price.
Halting Treasury Sales: The project has stopped selling T tokens from its treasury, signaling confidence in the token's future value and reducing potential market supply.
BitcoinWorld
Reducing Operational Expenses: By streamlining operations to save costs, the project aims for long-term sustainability in the volatile crypto landscape.
-----------------------------------------------------
Technical Analysis:
Now let's take a look at the Threshold(T) chart on the Daily timeframe.
Can we still take advantage of the increase in the price of T Token or not!? Please Stay with me.
The Threshold(T) project is moving near the Heavy Support zone($0.0189-$0.0147) and has managed to break the Resistance lines with a high-volume candle, which could be good news for the continuation of the T token's bullish trend.
The Threshold(T) Project also created a Bear Trap, which basically moves in the opposite direction of the Trap after traps on the price chart with high momentum, which is what happened here as well.
In terms of Elliott Wave theory, the T token is currently completing 5 impulsive waves after completing a Zigzag Correction(ABC/5-3-5), which seems like we should wait for the main wave 4 and then a re-increase.
I expect the T token to start rising again from the Potential Reversal Zone(PRZ) [$0.0200-$0.0173]and give us at least +30% profit opportunity.
Note: If the T token goes below $0.016, we should expect further decline and possibly a break of the Heavy Support zone($0.0189-$0.0147).
Please respect each other's ideas and express them politely if you agree or disagree.
Threshold Analyze (TUSDT), Daily time frame.
Be sure to follow the updated ideas.
Do not forget to put a Stop loss for your positions (For every position you want to open).
Please follow your strategy and updates; this is just my Idea, and I will gladly see your ideas in this post.
Please do not forget the ✅' like'✅ button 🙏😊 & Share it with your friends; thanks, and Trade safe.
Trade active
A short position of the T token hits the target.
It seems that the corrective waves are over, and we can expect the Threshold(T) project to start increasing by at least +10%.
🎁Welcome than a 50% bonus(Low Spread)👉vtm.pro/Y3AV7r
🎁Get a 20% Discount on your trading FEE on BYBIT:👉partner.bybit.com/b/PEJMANZWIN
🎁Get a 20% Bonus & 30% Discount on LBANK exchange(NO KYC)👉lbank.one/join/uBythQd
🎁Get a 20% Discount on your trading FEE on BYBIT:👉partner.bybit.com/b/PEJMANZWIN
🎁Get a 20% Bonus & 30% Discount on LBANK exchange(NO KYC)👉lbank.one/join/uBythQd
Disclaimer
The information and publications are not meant to be, and do not constitute, financial, investment, trading, or other types of advice or recommendations supplied or endorsed by TradingView. Read more in the Terms of Use.