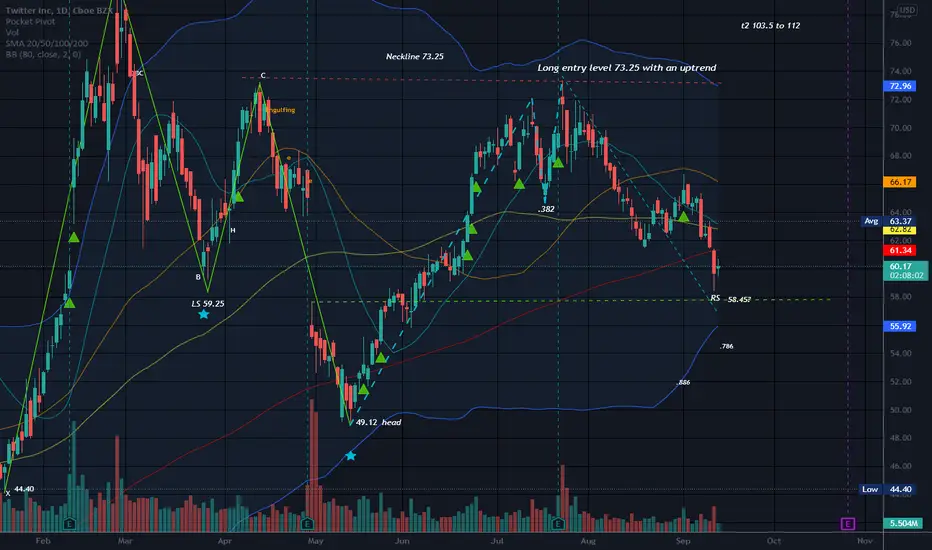
Long entry level is a break of the neckline, 73.25, with an uptrend.
I am watching for confirmation that the right shoulder has bottomed.
When price breaks the neckline, then somewhere under the neckline is a good stop.
Spinning top at this moment which is a candle of indecision, but is also a bullish harami.
Opposite of the head and shoulders top pattern, the inverse head and shoulders pattern, bottom, occurs after an extended move down. This pattern needs a neckline, which marks resistance, three valleys with the lowest one being the head, and a downtrend at the time it occurs. The right and left shoulders are rarely the exact same price, but does work better if the two are in the same ballpark. The pattern forms as price reaches the neckline and bounces off coming back down to form the 3 valleys. Although the pattern begins taking shape at the right shoulder (RS) it isn’t confirmed until the market closes above neckline resistance. This makes sense as price has not made it through the resistance on several occasions already (o:
Sometimes when in question, always respect resistance. Time can make resistance stronger. False breakouts do occur where price breaks the neckline only to return under it again in a short amount of time (throwback).
This pattern is not valid without a Close above the neckline and a confirmed uptrend. The neckline becomes support and a cautious trader may wait for price to pull back again to the neckline to test the new support level.
No recommendation
Disclaimer
The information and publications are not meant to be, and do not constitute, financial, investment, trading, or other types of advice or recommendations supplied or endorsed by TradingView. Read more in the Terms of Use.
Disclaimer
The information and publications are not meant to be, and do not constitute, financial, investment, trading, or other types of advice or recommendations supplied or endorsed by TradingView. Read more in the Terms of Use.