Hey there again,
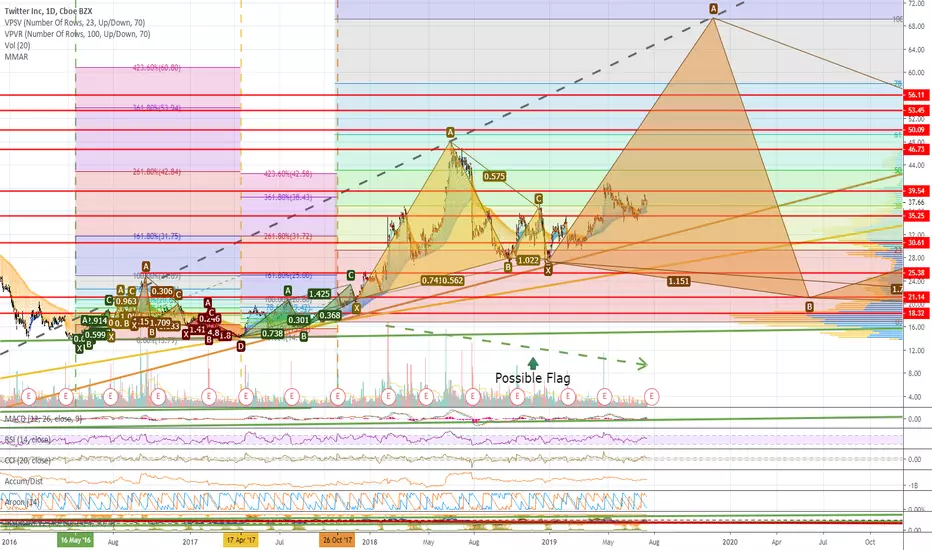
So time for some #Twitter #stocks charts analysis based as usual on #fractal #cycles. This has been done on a week/month time frame chart to analyze the whole panorama, and went deep until 1hour chart.
So as usual, this are just first images with some indicators stills. Pay attention on time frame on every image cause ill be posting some variations. As every analysis i post, this are just my ideas and not investments advice, so use it at your own risk.
Hope you find it interesting!
Happy trading! :)
Cheers!
Charter X
Note
So, The one on the top is the fractal we are going through at 2D time frame, and at the bottom the small fractal at 4hs time frame that happened before.This one is a 1D chart, so you may see the overall analysis and in more detail:
1 Week MacD:
1 month RSI
An finally 1 week RSIMirror and 1 month as well
There you go by now... ill try to keep ya updated so if interest just follow and you will receive when the update every time in a while ;)
Cheers!
Charter X
Disclaimer
The information and publications are not meant to be, and do not constitute, financial, investment, trading, or other types of advice or recommendations supplied or endorsed by TradingView. Read more in the Terms of Use.
Disclaimer
The information and publications are not meant to be, and do not constitute, financial, investment, trading, or other types of advice or recommendations supplied or endorsed by TradingView. Read more in the Terms of Use.