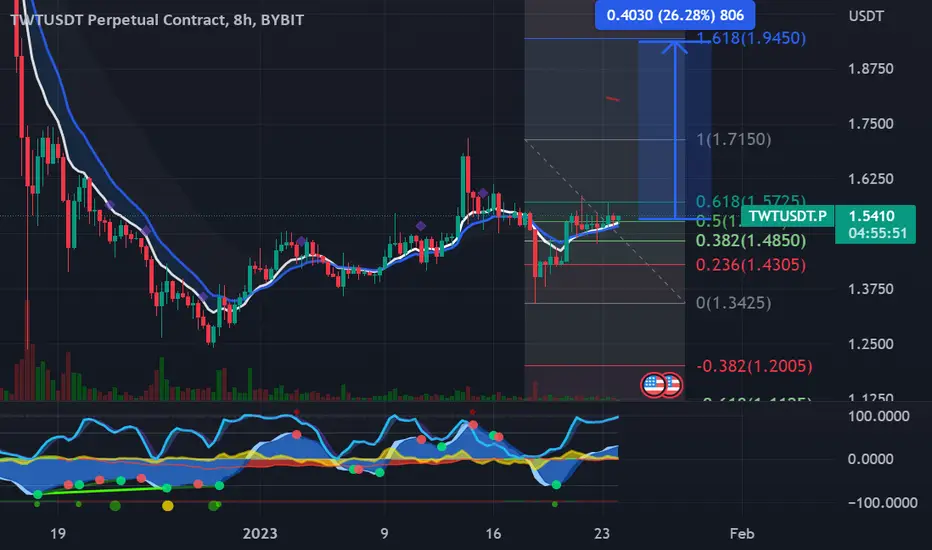
TWT has retested a key Fibonacci level at the bottom of a flag pattern, indicating potential for upward movement. Despite facing resistance on a short-term time frame, the strength of the daily candle suggests a bullish outlook. TWT has been consistently above my EMA’s, demonstrating sustained strength. I anticipate a swift price increase, with a target of the 1.618 Fibonacci level at $1.95.
This chart based off of The Elliot Wave Theory, Fibonacci, EMA’s, MacD , RSI , Momentum, and resistance/support zones combined with patterns.
This chart based off of The Elliot Wave Theory, Fibonacci, EMA’s, MacD , RSI , Momentum, and resistance/support zones combined with patterns.
Note
Here’s another opportunity to long TWT. BullishDisclaimer
The information and publications are not meant to be, and do not constitute, financial, investment, trading, or other types of advice or recommendations supplied or endorsed by TradingView. Read more in the Terms of Use.
Disclaimer
The information and publications are not meant to be, and do not constitute, financial, investment, trading, or other types of advice or recommendations supplied or endorsed by TradingView. Read more in the Terms of Use.