Hello Crypto Lovers,
Mars Signals team wishes you high profits.
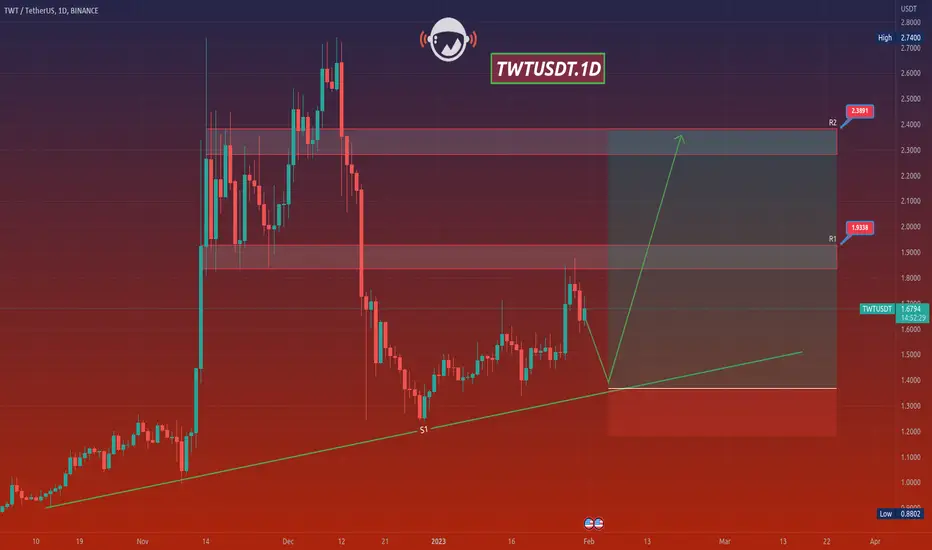
This is a one-day-time frame analysis for TWTUSDT
Here we have R2 as the resistance area that expresses the price was not able to rise at different points. R1 used to be a support area. And at the bottom of the chart, S1 is our long-term support line which includes the well support of price since the past at several points. Presently, we have the price fluctuating below R1 and we expect it to continue its decline to touch S1. Then by having some rising signs an increase would be there for the price up toward R1 or above that. Also, if the price loses the support at R1 or at its current point, a decline will be there for it to reach lower amounts such as S1 or even more. The point is to wait for some confirmation candles in order to make sure what will happen next and act precisely.
Warning: This is just a suggestion and we do not guarantee profits. We advise you to analyze the chart before opening any positions.
Wish you luck
Mars Signals team wishes you high profits.
This is a one-day-time frame analysis for TWTUSDT
Here we have R2 as the resistance area that expresses the price was not able to rise at different points. R1 used to be a support area. And at the bottom of the chart, S1 is our long-term support line which includes the well support of price since the past at several points. Presently, we have the price fluctuating below R1 and we expect it to continue its decline to touch S1. Then by having some rising signs an increase would be there for the price up toward R1 or above that. Also, if the price loses the support at R1 or at its current point, a decline will be there for it to reach lower amounts such as S1 or even more. The point is to wait for some confirmation candles in order to make sure what will happen next and act precisely.
Warning: This is just a suggestion and we do not guarantee profits. We advise you to analyze the chart before opening any positions.
Wish you luck
Disclaimer
The information and publications are not meant to be, and do not constitute, financial, investment, trading, or other types of advice or recommendations supplied or endorsed by TradingView. Read more in the Terms of Use.
Disclaimer
The information and publications are not meant to be, and do not constitute, financial, investment, trading, or other types of advice or recommendations supplied or endorsed by TradingView. Read more in the Terms of Use.