On the above 2 month chart price action has grown 1300% since the 2007-8 correction. A change in direction is now on the horizon for Texas Instruments.
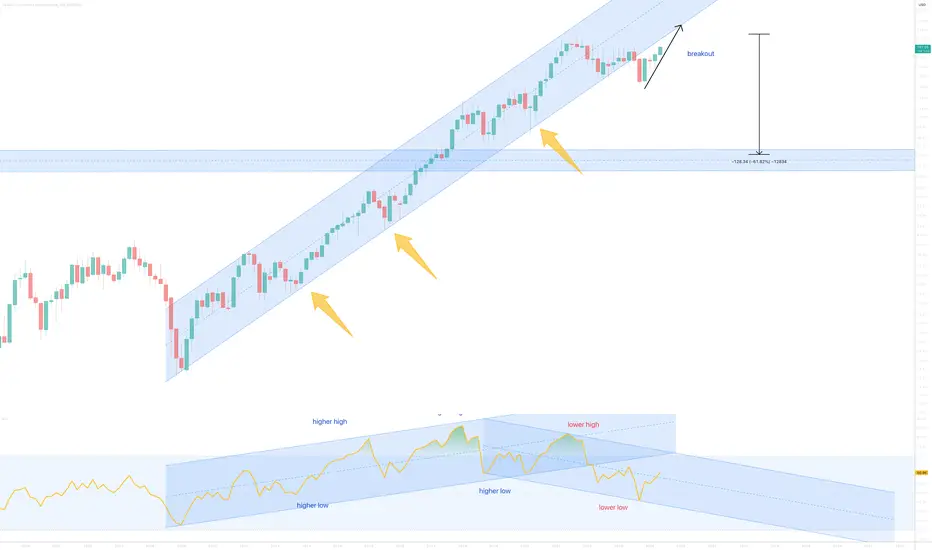
1) Support and resistance. The yellow arrows point to 15 years of price action support. That support has now failed.
2) A trend reversal in the RSI oscillator is clearly visible. This is bearish divergence.
3) The first level of support is $80.
4) The year 2030 will offer the first opportunity for a new investment opportunity.
Is it possible price action continues upwards? Sure.
Is it probable? No
A sell from $200 to $210 is excellent.
Ww
Trade active
Strong confirmation of resistance on past support.Note
On the 2 month chart a hanging man candle followed by a 2 month hammer candle (prints with the close of December) confirms this month.Price action did indeed touch $210 before rejection. For the long term, a full exit from this stock is recommended.
BTC
bc1q2eckdzh0q8vsd7swcc8et6ze7s99khhxyl7zwy
Weblink: patreon.com/withoutworries
Allow 3-6 months on ideas. Not investment advice. DYOR
bc1q2eckdzh0q8vsd7swcc8et6ze7s99khhxyl7zwy
Weblink: patreon.com/withoutworries
Allow 3-6 months on ideas. Not investment advice. DYOR
Disclaimer
The information and publications are not meant to be, and do not constitute, financial, investment, trading, or other types of advice or recommendations supplied or endorsed by TradingView. Read more in the Terms of Use.