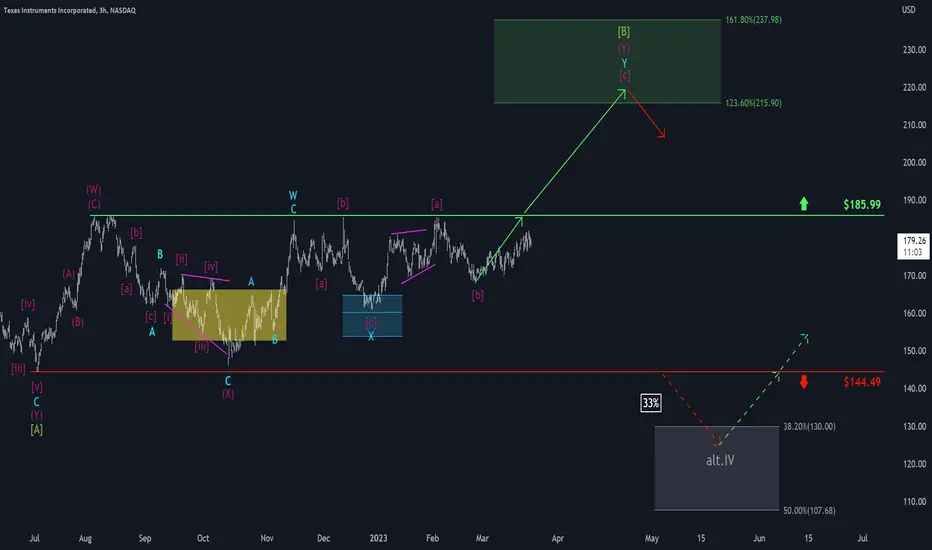
With a healthy respect, Texas Instruments is advancing toward the resistance line at $158.99 slowly but surely. Soon, the share should climb above this mark and push off into the green zone between $215.90 and $237.98 to complete wave B in green before turning downwards again. There is a 33% chance, though, that the course could shift away from the next resistance line, dropping below the support at $144.49 instead. In that case, we would expect Texas Instruments to develop wave alt.IV in gray in the gray zone between $130 and $107.68 before moving upwards anew.
📊 Free daily market insights combining macro + Elliott Wave analysis
🚀 Spot trends early with momentum, sentiment & price structure
🌐 Join thousands trading smarter - full free analyses at dailymarketupdate.com
🚀 Spot trends early with momentum, sentiment & price structure
🌐 Join thousands trading smarter - full free analyses at dailymarketupdate.com
Related publications
Disclaimer
The information and publications are not meant to be, and do not constitute, financial, investment, trading, or other types of advice or recommendations supplied or endorsed by TradingView. Read more in the Terms of Use.