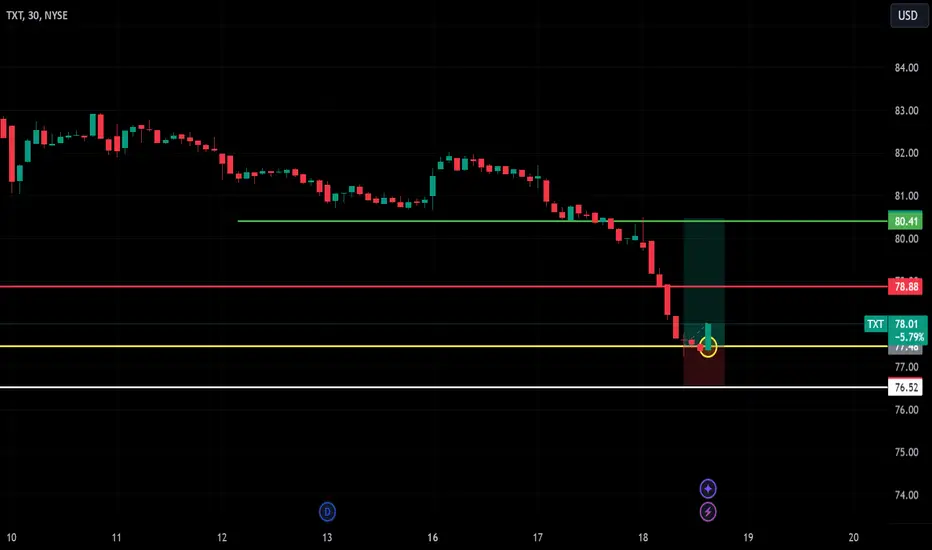
This chart for TXT (Textron Inc.) on a 30-minute timeframe showcases a potential reversal trade setup following a strong downward trend.
Entry Point:
The yellow-highlighted zone at 77.59 is marked as the entry level, signaling a buying opportunity after a significant decline.
Stop Loss:
Positioned just below at 76.52 (white line) to manage risk and protect against further downside.
Target Profit:
The green zone at 80.41 serves as the price target, aligning with prior resistance and offering a favorable risk-to-reward ratio.
Resistance & Support:
Red Line at 78.88: Short-term resistance.
Yellow Line at 77.59: Support, key zone for entry.
Disclaimer
The information and publications are not meant to be, and do not constitute, financial, investment, trading, or other types of advice or recommendations supplied or endorsed by TradingView. Read more in the Terms of Use.
Disclaimer
The information and publications are not meant to be, and do not constitute, financial, investment, trading, or other types of advice or recommendations supplied or endorsed by TradingView. Read more in the Terms of Use.