Yield spread vs. market top study - 3/10/2015
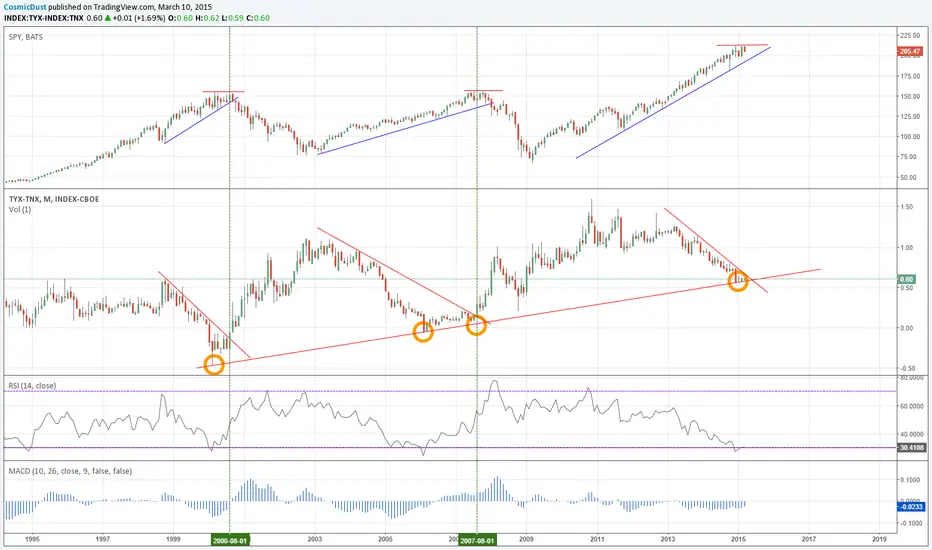
This chart studies spread between 30 year and 10 year treasury yield, and its correlation with SPY top. In 2000 and 2007, breakout of this spread marked the top of the market. So can this time be different? Let's wait until it breaks out (if ever) and then we will know.
Disclaimer
The information and publications are not meant to be, and do not constitute, financial, investment, trading, or other types of advice or recommendations supplied or endorsed by TradingView. Read more in the Terms of Use.
Disclaimer
The information and publications are not meant to be, and do not constitute, financial, investment, trading, or other types of advice or recommendations supplied or endorsed by TradingView. Read more in the Terms of Use.