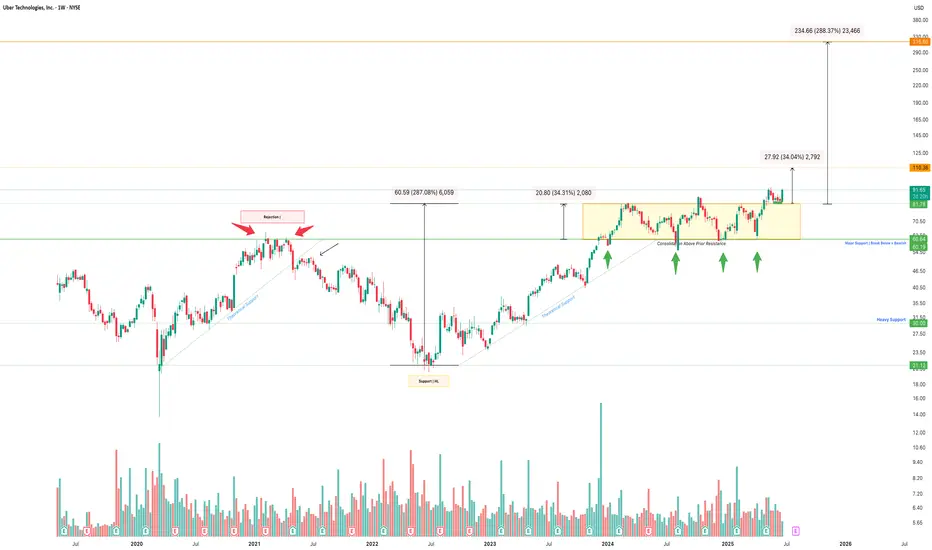
The chart of Uber Technologies Inc. (UBER) showcases a multi-year bullish setup following a prolonged accumulation phase and key breakout signals:
Consolidation: The stock entered a horizontal consolidation phase above previous resistance, now acting as strong support ($60–$80), confirmed by multiple bounce points (green arrows).
Measured Move Projection: The current breakout from consolidation implies a 34% immediate upside target to $110.36, followed by a long-term target of $316.90, mirroring the prior major impulse.
Volume Profile: Volume spikes during uptrends and stable participation during consolidation suggest institutional accumulation.
🔑 Key Technical Levels
Support Zones: $80.00 (major), $60.00 (breakdown risk),
Short-Term Target: $110.36
Long-Term Extension Target: $316.90 (288% move)
Disclaimer
The information and publications are not meant to be, and do not constitute, financial, investment, trading, or other types of advice or recommendations supplied or endorsed by TradingView. Read more in the Terms of Use.
Disclaimer
The information and publications are not meant to be, and do not constitute, financial, investment, trading, or other types of advice or recommendations supplied or endorsed by TradingView. Read more in the Terms of Use.