Shortly after releasing earnings, Uber’s stock has continued to decline, posting a new drop of over 4% in the latest session, as selling pressure remains dominant in the short term. Although results were in line with expectations —with earnings per share at $0.63 and total revenue reaching $12.65 billion, compared to the expected $12.46 billion— investor sentiment has turned cautious. Doubts have emerged regarding the company's ability to sustain its growth pace, and concerns are rising over potential overspending on autonomous driving projects. These factors have weakened confidence in the stock, and as long as uncertainty persists, selling pressure may continue to build.
Uptrend Remains Intact… for Now
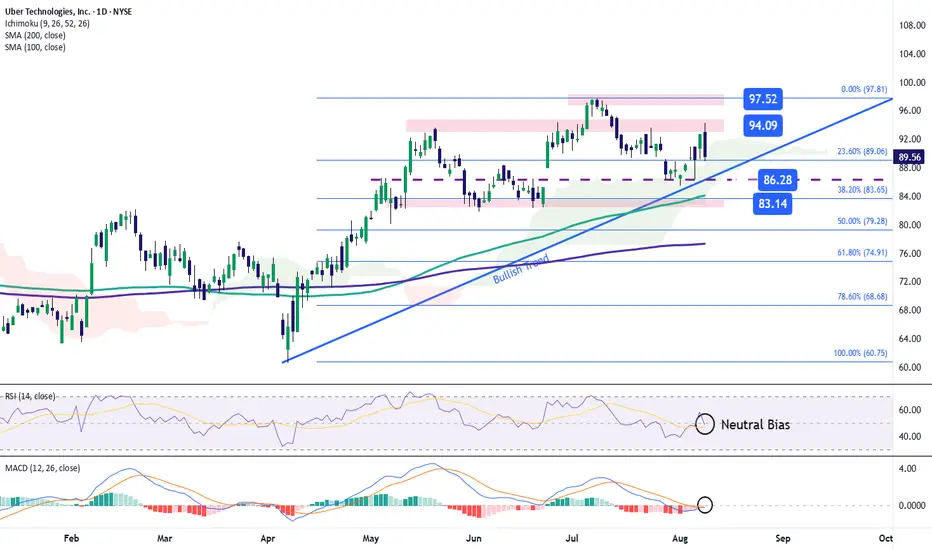
Since April 7, Uber’s stock has maintained a steady uptrend, which remains the dominant structure on the chart in the short term. While the recent downside correction has been notable, it has not yet been strong enough to clearly break the trend, so the long-term bias remains bullish for now. However, if bearish momentum strengthens, the integrity of this structure could begin to be challenged.
Indicators Show Neutral Momentum
Both the RSI line and the MACD histogram currently sit within a neutral zone, reflecting a lack of clear direction in the short term. If this setup persists, the recent sell-off may evolve into a more extended consolidation phase, with the price moving sideways until a new directional catalyst emerges.
Key Levels to Watch:
Written by Julian Pineda, CFA – Market Analyst
Uptrend Remains Intact… for Now
Since April 7, Uber’s stock has maintained a steady uptrend, which remains the dominant structure on the chart in the short term. While the recent downside correction has been notable, it has not yet been strong enough to clearly break the trend, so the long-term bias remains bullish for now. However, if bearish momentum strengthens, the integrity of this structure could begin to be challenged.
Indicators Show Neutral Momentum
Both the RSI line and the MACD histogram currently sit within a neutral zone, reflecting a lack of clear direction in the short term. If this setup persists, the recent sell-off may evolve into a more extended consolidation phase, with the price moving sideways until a new directional catalyst emerges.
Key Levels to Watch:
- $94 – Key Resistance:
This level aligns with a neutral zone observed in recent weeks. If the price climbs back above this area, it could reactivate the current uptrend. - $86 – Short-Term Support:
This level forms the base of the uptrend line. If selling pressure continues, it could act as a key support. A break below it may reflect growing uncertainty and trigger a stronger bearish bias. - $83 – Critical Support:
This zone coincides with the 38.2% Fibonacci retracement level and the 100-period simple moving average. A sustained move below this point could terminate the prevailing bullish structure on the chart.
Written by Julian Pineda, CFA – Market Analyst
Disclaimer
The information and publications are not meant to be, and do not constitute, financial, investment, trading, or other types of advice or recommendations supplied or endorsed by TradingView. Read more in the Terms of Use.
Disclaimer
The information and publications are not meant to be, and do not constitute, financial, investment, trading, or other types of advice or recommendations supplied or endorsed by TradingView. Read more in the Terms of Use.