Hello ,
This is not financial advice / not investing advice , do your home work please , i just provide my point of view and educate , thank you .
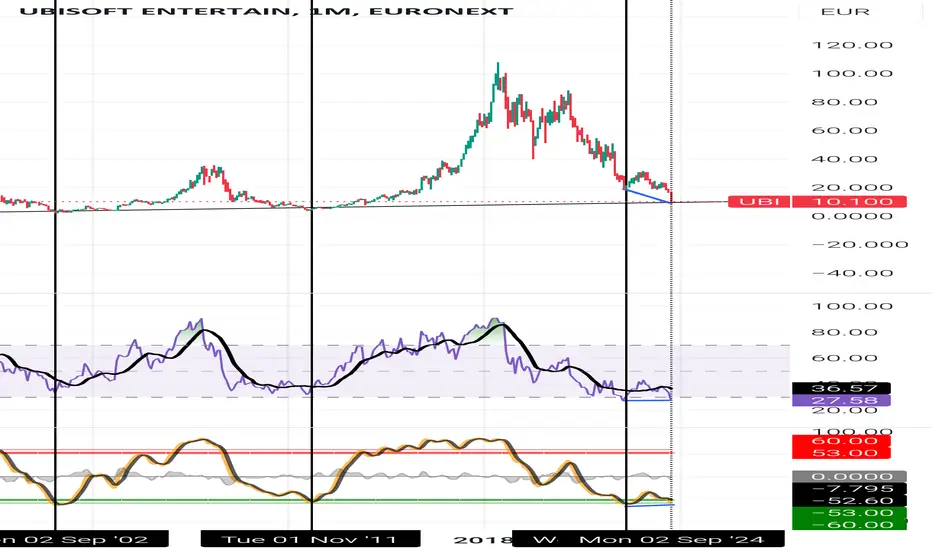
As presented in the wave trend indicator ,
We fell to an over sold area under the green line , which represent usually the best time to buy hence bottom area , only 2 times before we enterd this over sold area .
Looking at the price making lower low and both Rsi and WT doing higher low or same , giving a bullish divergence ... Make the bullish case stronger .
The hirizontal trend line comes from the 6month chart .
Happy to hear your thoughts .
Gl and enjoy.
This is not financial advice / not investing advice , do your home work please , i just provide my point of view and educate , thank you .
As presented in the wave trend indicator ,
We fell to an over sold area under the green line , which represent usually the best time to buy hence bottom area , only 2 times before we enterd this over sold area .
Looking at the price making lower low and both Rsi and WT doing higher low or same , giving a bullish divergence ... Make the bullish case stronger .
The hirizontal trend line comes from the 6month chart .
Happy to hear your thoughts .
Gl and enjoy.
Disclaimer
The information and publications are not meant to be, and do not constitute, financial, investment, trading, or other types of advice or recommendations supplied or endorsed by TradingView. Read more in the Terms of Use.
Disclaimer
The information and publications are not meant to be, and do not constitute, financial, investment, trading, or other types of advice or recommendations supplied or endorsed by TradingView. Read more in the Terms of Use.