Definition of an uptrend = higher highs, higher lows
In bullish territory on Ichimoku chart - above cloud and all lines
+1 point for dividend
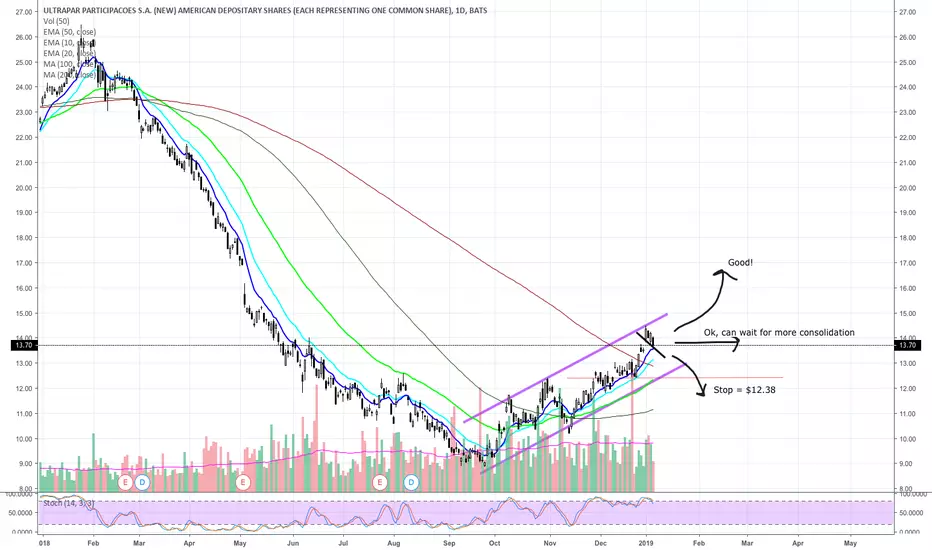
Watching only for now, if it consolidates (looking for doji's here) or shows bullishness I will buy, if it violates the 20 EMA - no trade
Target = $17.20 R/R = 2.65 (Stop = $12.38)
Fundamental
reuters.com/article/brazil-markets-bolsonaro/brazil-stock-market-hits-record-high-on-bolsonaros-potential-reforms-idUSL1N1Z41AO?rpc=401&
In bullish territory on Ichimoku chart - above cloud and all lines
+1 point for dividend
Watching only for now, if it consolidates (looking for doji's here) or shows bullishness I will buy, if it violates the 20 EMA - no trade
Target = $17.20 R/R = 2.65 (Stop = $12.38)
Fundamental
reuters.com/article/brazil-markets-bolsonaro/brazil-stock-market-hits-record-high-on-bolsonaros-potential-reforms-idUSL1N1Z41AO?rpc=401&
Trade active
Note
Moving protective stop to $14.14 ~20 EMADisclaimer
The information and publications are not meant to be, and do not constitute, financial, investment, trading, or other types of advice or recommendations supplied or endorsed by TradingView. Read more in the Terms of Use.
Disclaimer
The information and publications are not meant to be, and do not constitute, financial, investment, trading, or other types of advice or recommendations supplied or endorsed by TradingView. Read more in the Terms of Use.