📈 Possible Scenarios After the “UP” Signal on FTSE 100 (UK100):
✅ Scenario 1: Reversion Rally (Most Probable Based on the Indicator)
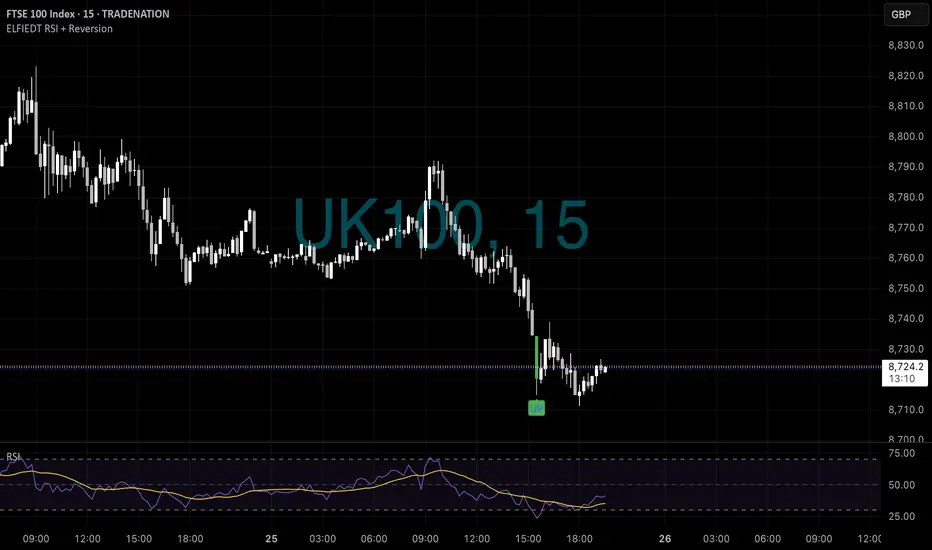
The “UP” label suggests the system has detected short-term exhaustion to the downside.
Price may now revert higher toward the previous breakdown zone (~8,740–8,755), acting as a first resistance and potential take-profit zone.
If momentum picks up, a second leg higher toward ~8,770 is possible, especially if other indices (e.g. DAX, US500) are bouncing as well.
🔹 Trade Idea: Long from signal candle close with SL just below the low of that candle, targeting 20–40 pts higher.
⚠️ Scenario 2: Shallow Bounce & Continuation Lower
If the bounce stalls below the 8,740 level and price begins consolidating with weak candles, this could signal a bearish continuation pattern.
In that case, expect a retest of 8,700 or even 8,680.
🔹 Action: Tighten stop once price hits +15 pts from entry. Watch for bearish reversal candles near 8,740.
🧠 Confluence Tips:
✅ Check if RSI is crossing back above its moving average from oversold territory — this adds confidence to the long setup.
🔁 Align the signal with other indices (e.g., if DAX or US100 also showed reversion UP signals at the same time, it strengthens the case).
📊 If volume increased on the signal candle, it likely confirms real interest at that level.
📌 Summary:
Your indicator just printed an “UP” reversal — historically this is a high-probability bounce zone. Immediate price action over the next 2–3 candles will confirm whether this is a true reversion move or just a pause before further downside.
✅ Scenario 1: Reversion Rally (Most Probable Based on the Indicator)
The “UP” label suggests the system has detected short-term exhaustion to the downside.
Price may now revert higher toward the previous breakdown zone (~8,740–8,755), acting as a first resistance and potential take-profit zone.
If momentum picks up, a second leg higher toward ~8,770 is possible, especially if other indices (e.g. DAX, US500) are bouncing as well.
🔹 Trade Idea: Long from signal candle close with SL just below the low of that candle, targeting 20–40 pts higher.
⚠️ Scenario 2: Shallow Bounce & Continuation Lower
If the bounce stalls below the 8,740 level and price begins consolidating with weak candles, this could signal a bearish continuation pattern.
In that case, expect a retest of 8,700 or even 8,680.
🔹 Action: Tighten stop once price hits +15 pts from entry. Watch for bearish reversal candles near 8,740.
🧠 Confluence Tips:
✅ Check if RSI is crossing back above its moving average from oversold territory — this adds confidence to the long setup.
🔁 Align the signal with other indices (e.g., if DAX or US100 also showed reversion UP signals at the same time, it strengthens the case).
📊 If volume increased on the signal candle, it likely confirms real interest at that level.
📌 Summary:
Your indicator just printed an “UP” reversal — historically this is a high-probability bounce zone. Immediate price action over the next 2–3 candles will confirm whether this is a true reversion move or just a pause before further downside.
Join us to get free access to all indicators we created!
Disclaimer
The information and publications are not meant to be, and do not constitute, financial, investment, trading, or other types of advice or recommendations supplied or endorsed by TradingView. Read more in the Terms of Use.
Join us to get free access to all indicators we created!
Disclaimer
The information and publications are not meant to be, and do not constitute, financial, investment, trading, or other types of advice or recommendations supplied or endorsed by TradingView. Read more in the Terms of Use.