FTSE 100 Index Closes at an All-Time High
Earlier, when analysing the chart of the UK’s FTSE 100 stock index, we outlined an ascending channel and anticipated a scenario with a continued upward trend and an attempt to establish a new historical high.
Since then:
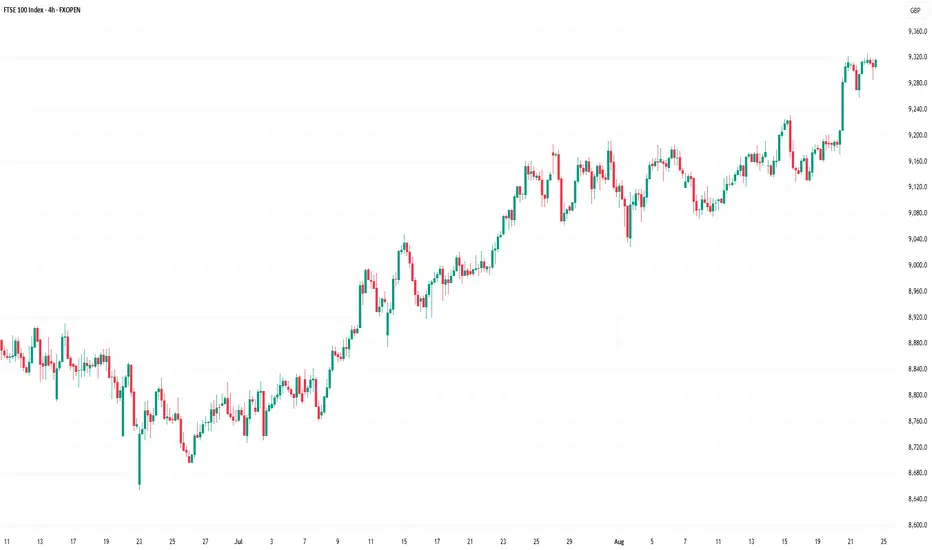
→ The index has risen by almost 5%. The channel structure has shifted slightly, but not dramatically – after adjustment, it remains relevant given the latest price dynamics.
→ Yesterday, the stock index climbed to 9,325, thereby setting an all-time high.
Bullish sentiment was supported by news of a shrinking public sector deficit and increased private sector output. How might the situation develop further?

Technical Analysis of the FTSE 100 Chart
From a bullish perspective:
→ The market remains in bullish territory.
→ The price successfully broke through the resistance zone at 9,180–9,200 (in effect since late July).
→ The 0→1 impulse was strong, signalling buyers’ dominance.
→ The price remains above the 50% Fibonacci retracement of the 0→1 impulse, which may serve as support during a pullback.
→ Additional support could come from the green zone, where bulls were strong during the breakout above the 9,180–9,200 resistance area.
From a bearish perspective: the upper boundary of the channel has confirmed its role as resistance. At the same time, peaks 1 and 2 have formed:
→ They show signs of a bearish Double Top pattern, creating bearish divergence with the RSI indicator.
→ The fact that the second peak is slightly above the first adds weight to the bearish case: this could have been a bull trap for late buyers, while in reality the rally may already be exhausted.
The ability of bulls to keep the price above the green zone may confirm the strength of the FTSE 100. Nevertheless, in the short term, scenarios involving pullbacks and retests of the mentioned support levels might be realised (as seen in early August, when the 9,040 level was tested in an aggressive manner).
This article represents the opinion of the Companies operating under the FXOpen brand only. It is not to be construed as an offer, solicitation, or recommendation with respect to products and services provided by the Companies operating under the FXOpen brand, nor is it to be considered financial advice.
Earlier, when analysing the chart of the UK’s FTSE 100 stock index, we outlined an ascending channel and anticipated a scenario with a continued upward trend and an attempt to establish a new historical high.
Since then:
→ The index has risen by almost 5%. The channel structure has shifted slightly, but not dramatically – after adjustment, it remains relevant given the latest price dynamics.
→ Yesterday, the stock index climbed to 9,325, thereby setting an all-time high.
Bullish sentiment was supported by news of a shrinking public sector deficit and increased private sector output. How might the situation develop further?
Technical Analysis of the FTSE 100 Chart
From a bullish perspective:
→ The market remains in bullish territory.
→ The price successfully broke through the resistance zone at 9,180–9,200 (in effect since late July).
→ The 0→1 impulse was strong, signalling buyers’ dominance.
→ The price remains above the 50% Fibonacci retracement of the 0→1 impulse, which may serve as support during a pullback.
→ Additional support could come from the green zone, where bulls were strong during the breakout above the 9,180–9,200 resistance area.
From a bearish perspective: the upper boundary of the channel has confirmed its role as resistance. At the same time, peaks 1 and 2 have formed:
→ They show signs of a bearish Double Top pattern, creating bearish divergence with the RSI indicator.
→ The fact that the second peak is slightly above the first adds weight to the bearish case: this could have been a bull trap for late buyers, while in reality the rally may already be exhausted.
The ability of bulls to keep the price above the green zone may confirm the strength of the FTSE 100. Nevertheless, in the short term, scenarios involving pullbacks and retests of the mentioned support levels might be realised (as seen in early August, when the 9,040 level was tested in an aggressive manner).
This article represents the opinion of the Companies operating under the FXOpen brand only. It is not to be construed as an offer, solicitation, or recommendation with respect to products and services provided by the Companies operating under the FXOpen brand, nor is it to be considered financial advice.
Disclaimer
The information and publications are not meant to be, and do not constitute, financial, investment, trading, or other types of advice or recommendations supplied or endorsed by TradingView. Read more in the Terms of Use.
Disclaimer
The information and publications are not meant to be, and do not constitute, financial, investment, trading, or other types of advice or recommendations supplied or endorsed by TradingView. Read more in the Terms of Use.