FTSE100 WEEKLY CHART IS BEARISH WITH PRICE FORMING A DOUBLE TOP PATTERN
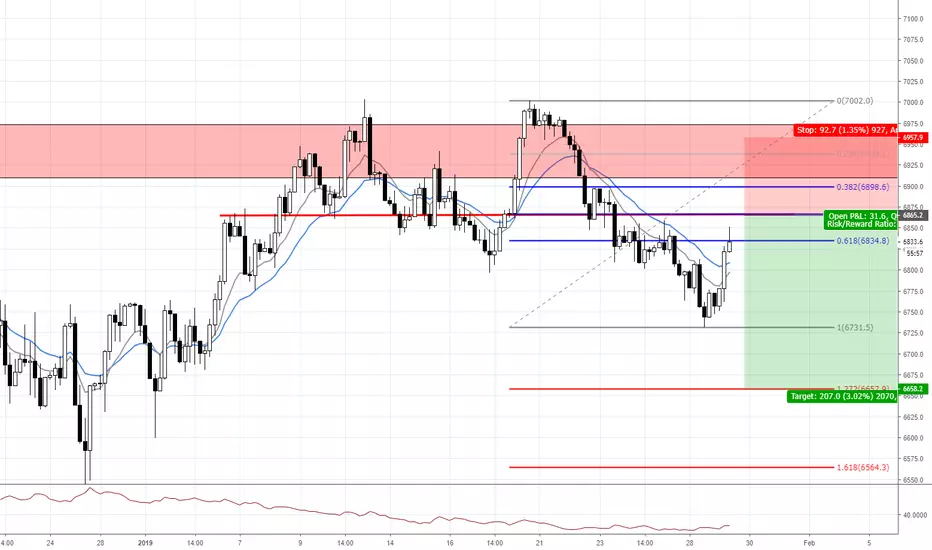
ON THE DAILY CHART, 4HR TIMEFRAME IS RETRACING INTO A KEY ZONE WITH 50% FIB
A PARTICULAR AREA OF INTEREST.
ENTRY- 6865.2
STOP- 6958.0
TARGET- 6658.0
ON THE DAILY CHART, 4HR TIMEFRAME IS RETRACING INTO A KEY ZONE WITH 50% FIB
A PARTICULAR AREA OF INTEREST.
ENTRY- 6865.2
STOP- 6958.0
TARGET- 6658.0
Disclaimer
The information and publications are not meant to be, and do not constitute, financial, investment, trading, or other types of advice or recommendations supplied or endorsed by TradingView. Read more in the Terms of Use.
Disclaimer
The information and publications are not meant to be, and do not constitute, financial, investment, trading, or other types of advice or recommendations supplied or endorsed by TradingView. Read more in the Terms of Use.