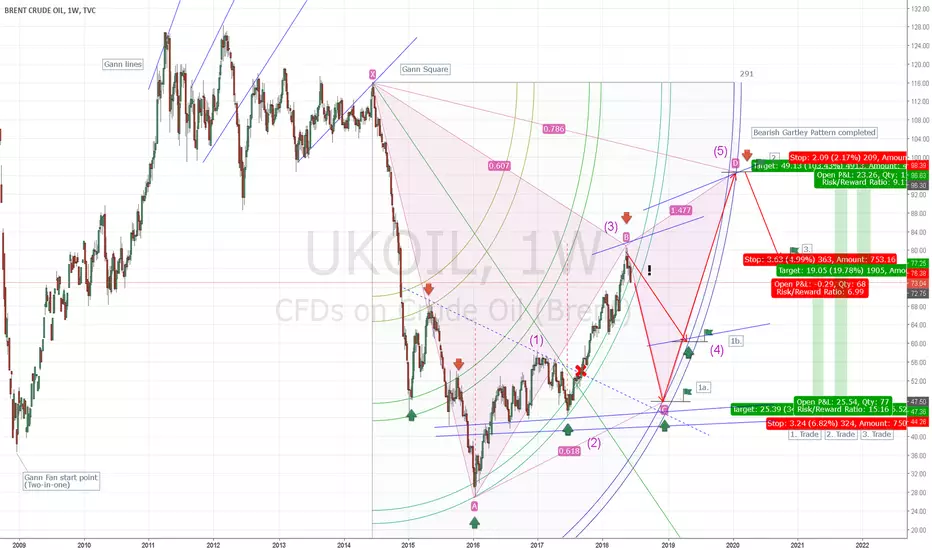
I think UKOIL will descend the next months. Here is why:
- It just hit the Global Gann fan and went down right after.
- It just completed the head & shoulders potential. I've moved the starting point to the right shoulder.
- It just made the 1.618 level from the (1) leg (Elliot Wave theory).
- It turn down after hitting the 0.618 fibonacci level from the Gann Square starting point.
Forecast (My wild guess!) :
- It will break through the arc (A critical moment on the idea).
- It will descend down to either 60$ (Trade 1b) or 48$ (Trade 1a).
- Then it will probably turn up again and complete the bearish Gartley pattern, arround 96$ (Trade 2).
- After the (5) wave it will turn down to the local 0.382 fibonacci level (Trade 3).
This is not an advice. Make your own strategy and hold on to it ;)
Note
It seems like it broke through a descending wedge that will make it rise a bit the next days, but not high enough to go higher than the earliest high = 80,5$. I think a new entry around 79$ would work (1a and 1b).Note
This is also confirmed by 0.886 fibonacci level:Note
79$ reached - Entry on a short position should work right now (trade 1a and 1b).Note
Note
Possible scenario ahead? Note
Possible scenario: Testing the upper line. Note
UKOIL is dropping big time now. I've marked the critical area on the arc. Breaking through here will indicate down trend. Note
After a small pullback (The drop made a great long trade for you daredevils:P), is working it's path down to the bottom line in this descending triangle. That is how I see it for now. Below I showed where I think it could drop or rise:
Note
Note
Sorry for my english, I hope it is understandable :PNote
Breaking news! We are very close to the sell zone! Note
I think a short position right now could be a good move. Make sure you use a stop loss(!).Note
Stop loss at 73.64? Trade active
Note
According to Gann square I think UKOIL is doomed right now. But the bulls are still fighting on the edge. Note
I think we can take advantage of the same sell zone, just the other way around this time. Our earlier stop loss should be fine in that way but might be a bit low later on, if a ascending wedge appears for instance:Note
I've been at holidays lately and that is why I haven't updated lately. It seems like that the stop loss I proposed last update got triggered unfortunately. I'm still bearish though and I think it might be possible to do another entry now. This is because the 5.wave very often fails halfway and a drop appears. I've also many times seen that it traces the arc before it evenutally breaks through for good.
Lets see what happens!
Note
Possible break out on small wedge right now! Maybe this will trigger it downwards?Note
Here is a image on the wedge break out:Note
It might do a pullback very soon. Lets see! Note
Touchdown! A small pullback next I think.Note
It might be possible to do a entry again now. Local 0.5 fib level has been reached. We also have a inside bar on weekly now. This may confirm the down trend.
Note
The arc / sell zone could be use as a entry / stop loss too. Note
Here is another short term scenario. It actually fits the wedge pattern too.Note
Big drop today! Seems like "the sell zone" was strong enough this time. If it breaks the previous lower point I think it will continue downards and the original idea could restart (1a and 1b). Note
Here is another scenario that could trigger the next step. If not the upper line could work as a retracement. Note
After testing the bottom line and the triangle pattern several times it is finally going down.Note
It might bounce upwards now:Note
According to EW Wave 4 should be above wave 1, in other words it shouldn't go any lower at this point. But we still have the last blue arc as a support if EW doesn't work as planned. Right now it is waiting for the next step at the current Gann line.
Note
It didn't manage to stay above the gann line, and it might go down to level 1a.Note
Closer look on the Targets:Note
Entry 1a* hit and take off!Note
A small pit stop the next days?Note
Status: Alternative routes ahead.Note
Alternative Idea: Gann + Fib might be telling us the next stepNote
Another support line that might work:Note
The global Gann line might also be as a support currently:Note
Currently testing the outer gann arc(!).Note
Take off again??Note
After a small take off it is testing the outer arc again.Note
The support line from the Alternative idea looks very strong:Note
Back to the Original idea: I've been drawing some resistance lines that I think we should be aware of (Dotted lines). It looks quite messy currently but the tactic is to stay inside the Outer Gann Arc and we should be fine. Also make sure to move the stop loss now when we have completed the local 0.618 fib. A great thing at this point: Since the price is now very close to the outer Gann arc we can now move the stop loss continuously along this path (The red dotted curve).
Note
Currently testing the Gann arc:Note
Looks like it is breaking through the Gann arc. Although it could be some drawing error.Note
Seems like it is still inside the Gann arc.Note
Note
Not looking good...Note
Here is my latest idea on UKOIL: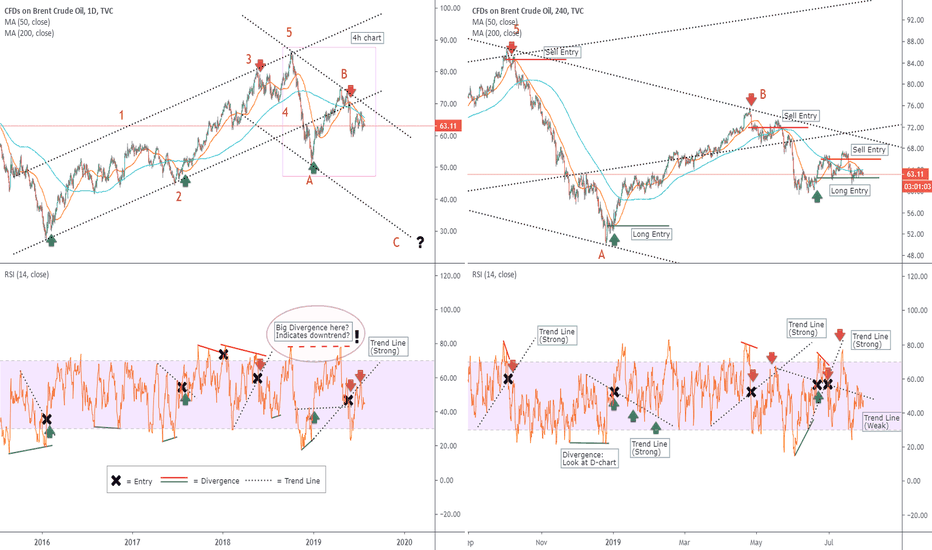
Disclaimer
The information and publications are not meant to be, and do not constitute, financial, investment, trading, or other types of advice or recommendations supplied or endorsed by TradingView. Read more in the Terms of Use.
Disclaimer
The information and publications are not meant to be, and do not constitute, financial, investment, trading, or other types of advice or recommendations supplied or endorsed by TradingView. Read more in the Terms of Use.