Hourly chart pattern - bearish price RSI divergence
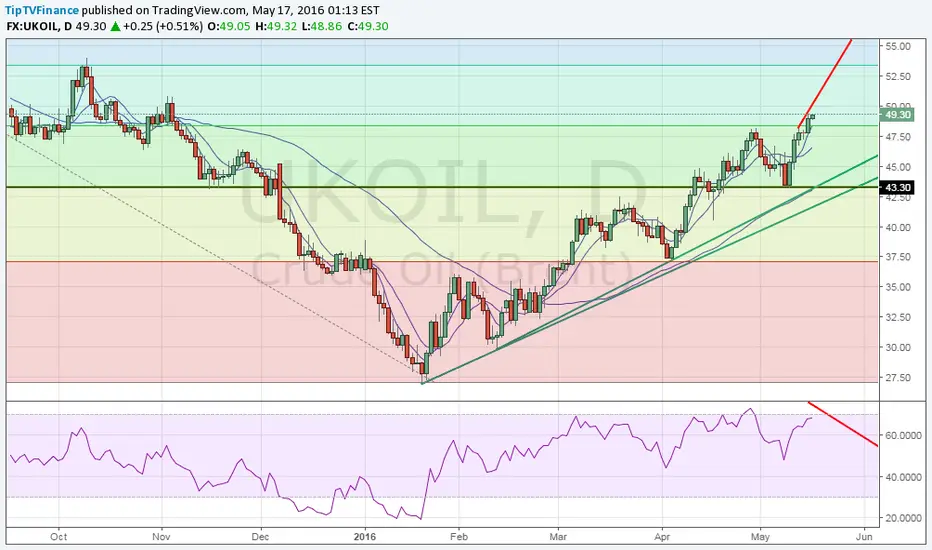
Resistance - $50.00, $50.89, $52.00
Support - $47.79, $46.80, $45.32
Brent appears poised to test psychological level of $50.00 if prices confirm a close above $49.38 on hourly chart. Moreover, such a closing would negate the bearish price RSI divergence on the hourly chart.
Failure to do so could trigger a minor technical correction in oil prices.
However, bullish invalidation is seen only if prices see a day end closing below $48.26, in which case we would have a bearish price RSI divergence on the daily chart.
Related publications
Disclaimer
The information and publications are not meant to be, and do not constitute, financial, investment, trading, or other types of advice or recommendations supplied or endorsed by TradingView. Read more in the Terms of Use.
Related publications
Disclaimer
The information and publications are not meant to be, and do not constitute, financial, investment, trading, or other types of advice or recommendations supplied or endorsed by TradingView. Read more in the Terms of Use.