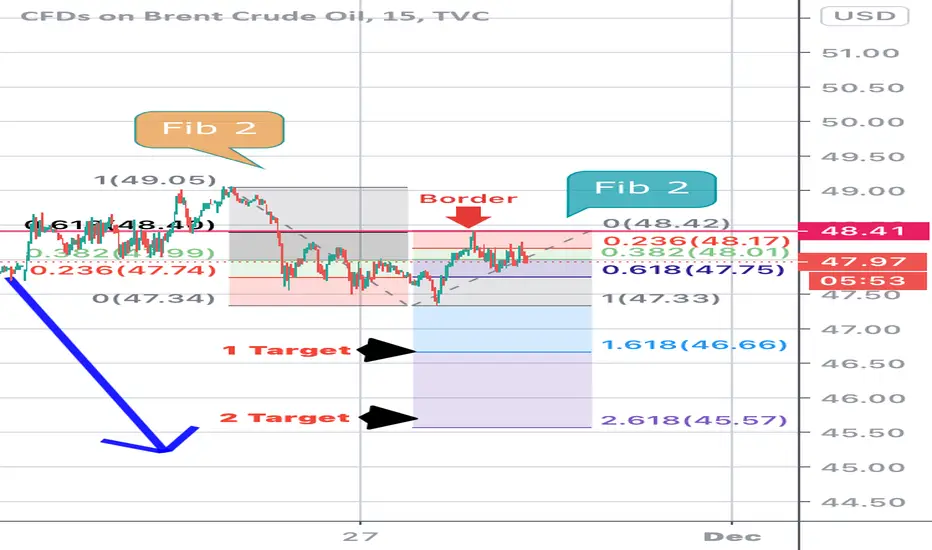
It can be seen from the chart above, that the price of Brent (UKOIL) at 48.40 has touched the Fibonacci retracement at the 61.8% level (Fib 2 left) and there is a big possibility of a downward movement with the first target at 46.66 at the 161.8% Fibonacci retracement level (Fib 2 right), and continued with the second target at the price of 45.57 at the level of 261.8% Fibonacci retracement (Fib 2 right). If it turns out that the movement is the opposite towards the upside by passing the price at 48.42 (Border line), then the price is likely to go up.
Disclaimer
The information and publications are not meant to be, and do not constitute, financial, investment, trading, or other types of advice or recommendations supplied or endorsed by TradingView. Read more in the Terms of Use.
Disclaimer
The information and publications are not meant to be, and do not constitute, financial, investment, trading, or other types of advice or recommendations supplied or endorsed by TradingView. Read more in the Terms of Use.