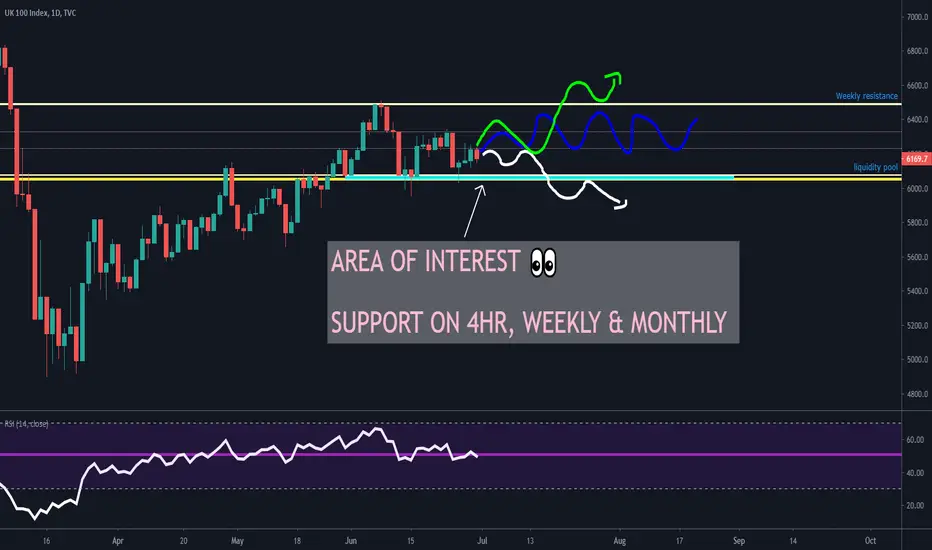
The biggest level on the FTSE100 charts is the 6,000 support, on the 4 hour, daily and weekly level this is an area of support.
What does it mean if support is shown on a number of time-frames? It means everyone trading the FTSE100 has the 6k level on their charts, it's also a psychological level.
The 6k level was tested 3 times in June, each time bouncing back, most likely trapping shorts who entered trades too early.
The 6,500 level is weekly resistance, it tested it once and got rejected pretty hard.
There are 3 cases for the FTSE100 going into July, I’ll start from bullish to bearish:
Bull case (green line) – for me to to go long on the FTSE100, I’d like to see a clear break of the 6,500 level, and on any re-test of the 6,500 I’d be looking at long positions.
Neutral case (blue line) – FTSE carries on consolidating between the 6,500-6,000 range.
Bear case (white line) – FTSE clearly breaks 6,000 support and re-tests it’s lows.
Whether we move up down or sideways will depend on what type of recover we get in the UK, so far things do not look good and I'd lean towards a break of the 6,000 level before we break-through the 6,500 level.
If I see any long or short trade ideas, I'll be posting them on TV, so be sure to give me a follow if you enjoy my charting and comments.
Enjoy my idea? Be sure to give my account a follow as I cover all major markets including, gold, Bitcoin, silver, Forex and stock markets. Have a question? Feel free to leave a comment, I aim to answer all questions :).
Disclaimer
The information and publications are not meant to be, and do not constitute, financial, investment, trading, or other types of advice or recommendations supplied or endorsed by TradingView. Read more in the Terms of Use.
Disclaimer
The information and publications are not meant to be, and do not constitute, financial, investment, trading, or other types of advice or recommendations supplied or endorsed by TradingView. Read more in the Terms of Use.